Chapter 4 — Architecture Design
This chapter presents the system topology, station layout, and communications architecture for a complete surface water environmental monitoring network. It covers the three-layer deployment model, typical station configurations for rivers and lakes, network topology options, data flow design, and the engineering decisions that determine system reliability and scalability.
4.1 Typical System Topology
The surface water monitoring system is organized in three functional layers that map to distinct physical and logical domains. The Field Layer encompasses all in-water and bank-side hardware that directly interfaces with the water body. The Edge/Station Layer houses the control, measurement, pre-treatment, and communications equipment within the station enclosure. The Cloud/Center Platform Layer provides centralized data ingestion, storage, QA/QC, alarm management, reporting, and integration with regulatory systems. This layered architecture enables independent scaling, maintenance, and security management of each layer without affecting the others.
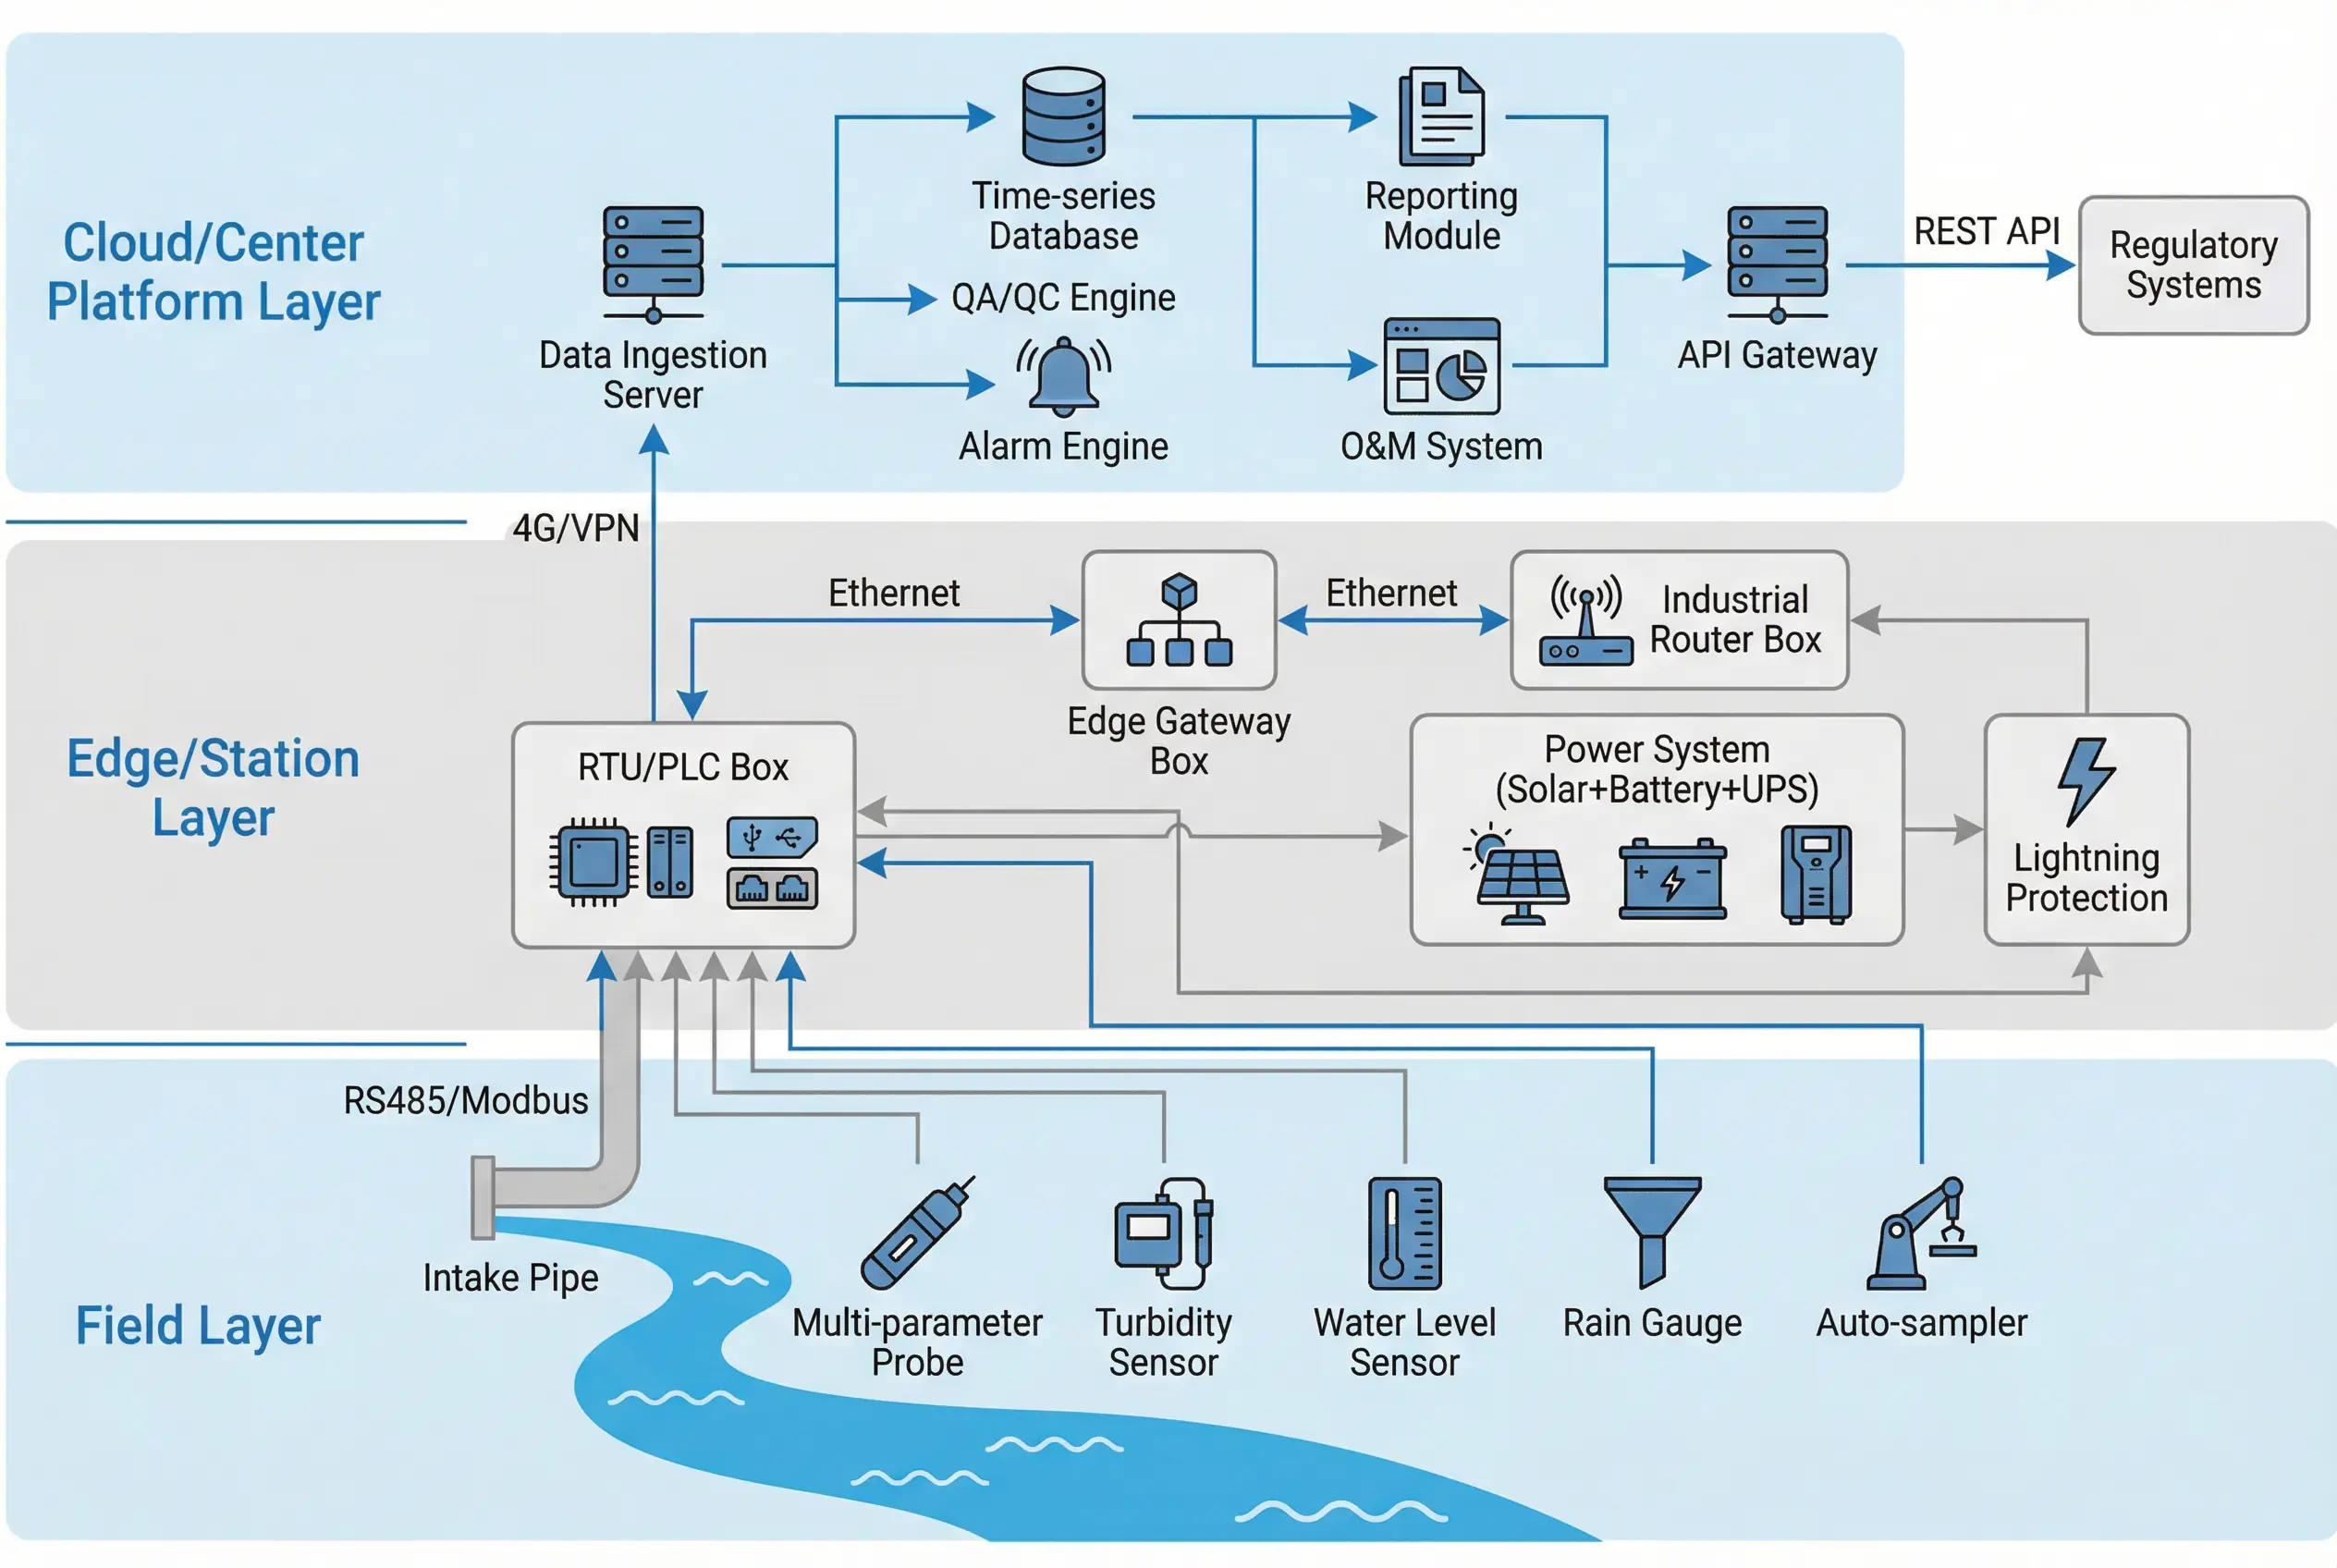
Figure 4.1: Typical system topology — three-layer architecture from field sensors through edge station to cloud/center platform, with labeled communication protocols and data flows
Data flows upward from field sensors through RS485/Modbus to the RTU/PLC, then via Ethernet to the edge gateway, and finally via 4G/VPN encrypted tunnel to the central platform. Control commands flow downward through the same path. The edge gateway maintains a local time-series buffer to ensure no data loss during network outages, and automatically resynchronizes with the central platform on reconnection using a store-and-forward mechanism.
4.2 Station Layout and Configuration Options
Three standard station configurations address the majority of surface water monitoring deployments. The configuration selection is driven by the monitoring objectives, site access, power availability, and budget. Each configuration can be expanded with optional modules as requirements evolve.
| Configuration | Description | Typical Application | Station Footprint | Power |
|---|---|---|---|---|
| Type A — Compact Buoy/Pole | Submersible multi-parameter sonde + data logger + 4G modem; no pre-treatment; direct immersion | Low-turbidity lakes, reservoirs, preliminary screening | Single pole or buoy | Solar + 50 Ah battery |
| Type B — Standard Cabinet Station | Intake + pre-treatment + flow cell + probes + RTU + gateway + router; weatherproof cabinet | Rivers, lakes with moderate turbidity; regulatory compliance | 1–2 m² cabinet on plinth | Grid/Solar + UPS |
| Type C — Full Shelter Station | All Type B components + auto-sampler + advanced analyzers + HVAC + CCTV; climate-controlled shelter | Drinking water source protection; high-turbidity rivers; legal evidence | 6–12 m² shelter | Grid + UPS + Generator backup |
4.3 Communications Architecture
The communications architecture defines how data flows from the station to the central platform and how remote management commands reach the station. A resilient communications design uses a primary channel with automatic failover to a backup channel, ensuring continuity during network outages. The table below presents the recommended primary and backup channel combinations for different deployment contexts.
| Deployment Context | Primary Channel | Backup Channel | Typical Latency | Bandwidth | Security |
|---|---|---|---|---|---|
| Urban / suburban river | 4G/5G cellular | Wired Ethernet / fiber | < 1 s | High | VPN + TLS 1.3 |
| Rural / agricultural | 4G cellular | NB-IoT | 1–5 s | Medium | VPN + TLS 1.3 |
| Remote / off-grid | Satellite (Iridium SBD) | LoRa relay | 30–120 s | Low | Encrypted payload |
| Flood-prone river | 4G cellular | Satellite | < 5 s | Medium | VPN + TLS 1.3 |
| Drinking water source | Fiber / wired Ethernet | Dual SIM 4G/5G | < 0.1 s | High | VPN + TLS 1.3 + RBAC |
4.4 Station Cabinet Wiring Diagram
The station cabinet wiring diagram illustrates the internal layout and electrical connections of a Type B standard cabinet station. The diagram shows the DIN-rail mounted components, cable routing, terminal block assignments, and color-coded wiring for power, signal, and communications circuits. This diagram serves as the reference for cabinet assembly, factory acceptance testing, and field troubleshooting.
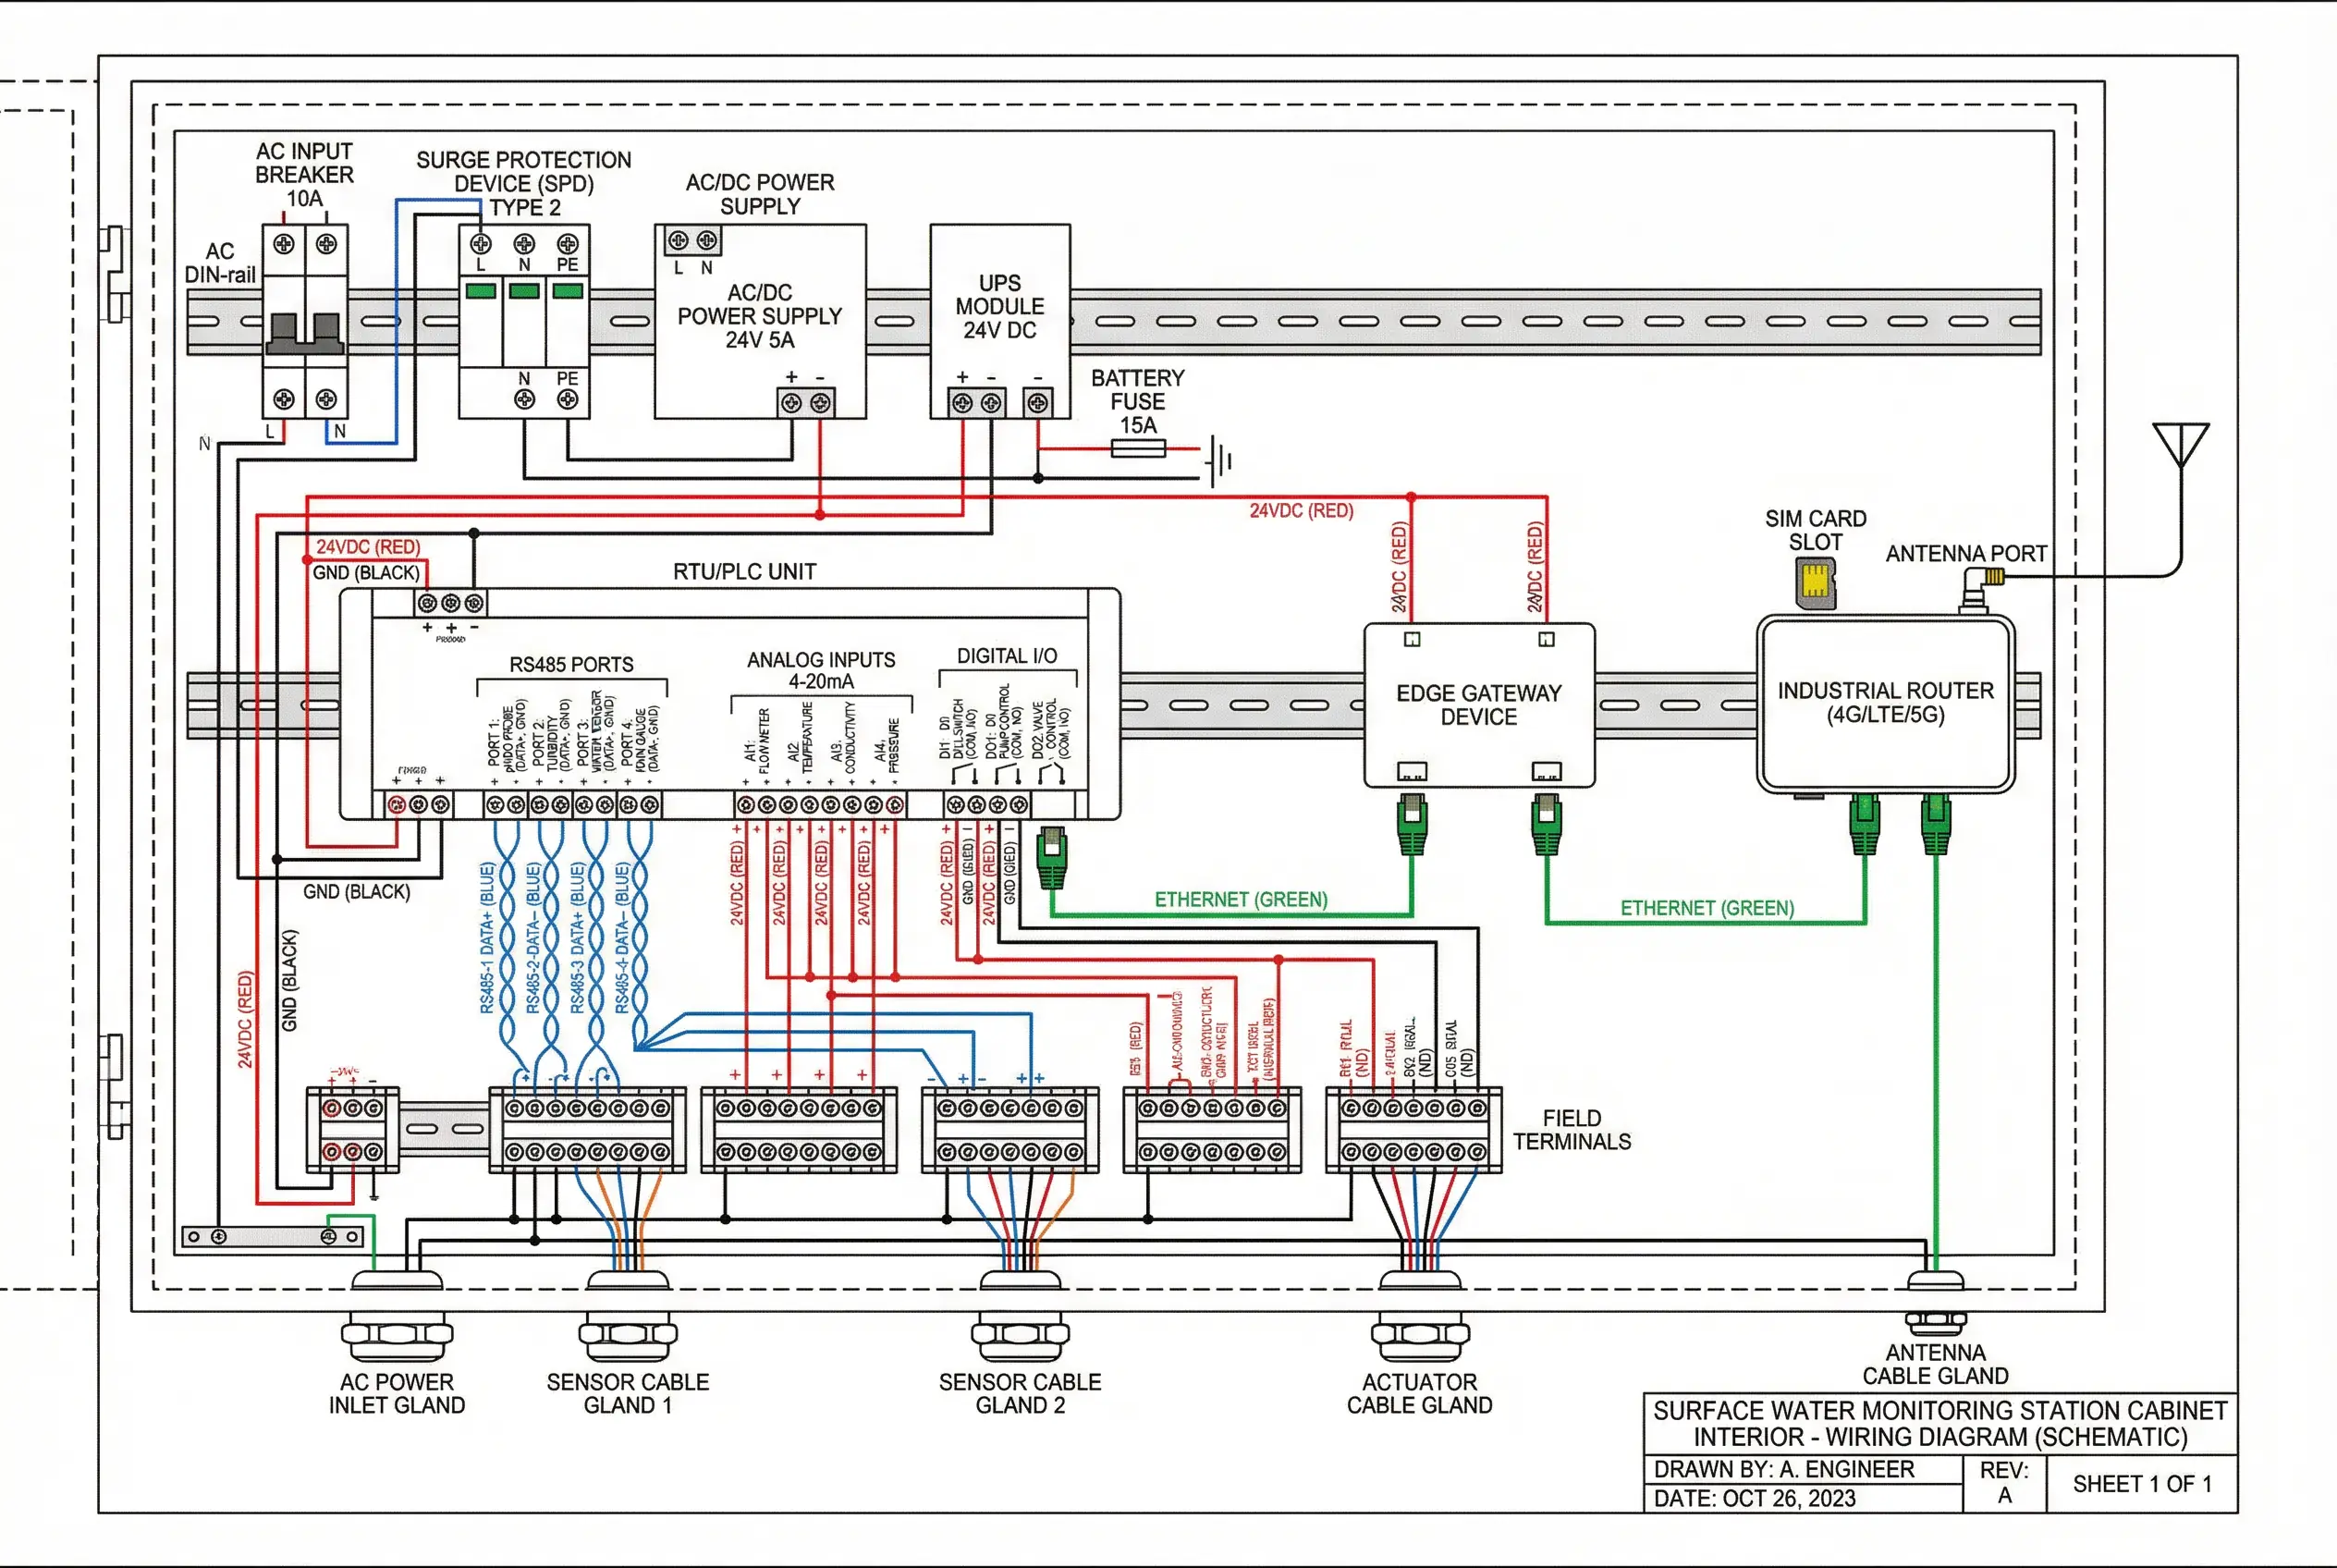
Figure 4.2: Station cabinet wiring diagram — DIN-rail layout showing AC input, SPD, power supply, UPS, RTU/PLC, edge gateway, industrial router, terminal blocks, and cable glands with color-coded wiring
Key wiring conventions applied in this diagram are as follows. Red conductors carry 24 VDC positive supply. Black conductors are ground/return. Blue conductors carry RS485 differential signals (A+ and B−). Green conductors are Ethernet Cat5e/6 cables. Orange conductors carry 4–20 mA analog signals. All RS485 cables are shielded twisted pair (STP), with the shield connected to ground at one end only (typically at the RTU terminal block) to prevent ground loops. Ethernet cables between the gateway and router use industrial-grade Cat6 with molded strain-relief boots.
4.5 Data Flow and Edge Buffering Strategy
The data flow architecture is designed to guarantee zero data loss under all foreseeable network conditions. The edge gateway implements a store-and-forward buffer that accumulates time-stamped measurement records during network outages and transmits them in chronological order on reconnection. The buffer capacity is sized for the worst expected outage duration at each site, with a minimum of 7 days and a recommended 30 days for remote sites.
| Data Flow Stage | Protocol | Buffer Location | Buffer Capacity | Retry Logic |
|---|---|---|---|---|
| Sensor → RTU | RS485 Modbus RTU | RTU RAM (volatile) | Last 100 records | 3 retries, 1 s interval |
| RTU → Edge Gateway | Modbus TCP / JSON over Ethernet | Gateway flash storage | ≥ 30 days at 5-min interval | Continuous retry; FIFO queue |
| Gateway → Cloud | MQTT / HTTPS; VPN tunnel | Cloud ingestion queue | Unlimited (cloud storage) | Exponential backoff; ACK required |
| Cloud → Regulatory | REST API / FTP / custom | Cloud outbox queue | Configurable (typically 7 days) | 3 retries; alert on failure |