Chapter 3 — Scenarios & Selection
This chapter presents eight representative deployment scenarios for surface water environmental monitoring systems, covering rivers, lakes, reservoirs, and specialized environments. Each scenario is illustrated with a real-world deployment photograph and accompanied by a description of the monitoring objectives, recommended configuration, and key technical specifications. The scenarios are designed to guide system designers in matching the appropriate station type, sensor suite, and engineering measures to specific site conditions and regulatory requirements.
Scenario 1 — Industrial Discharge Impact Assessment (River)
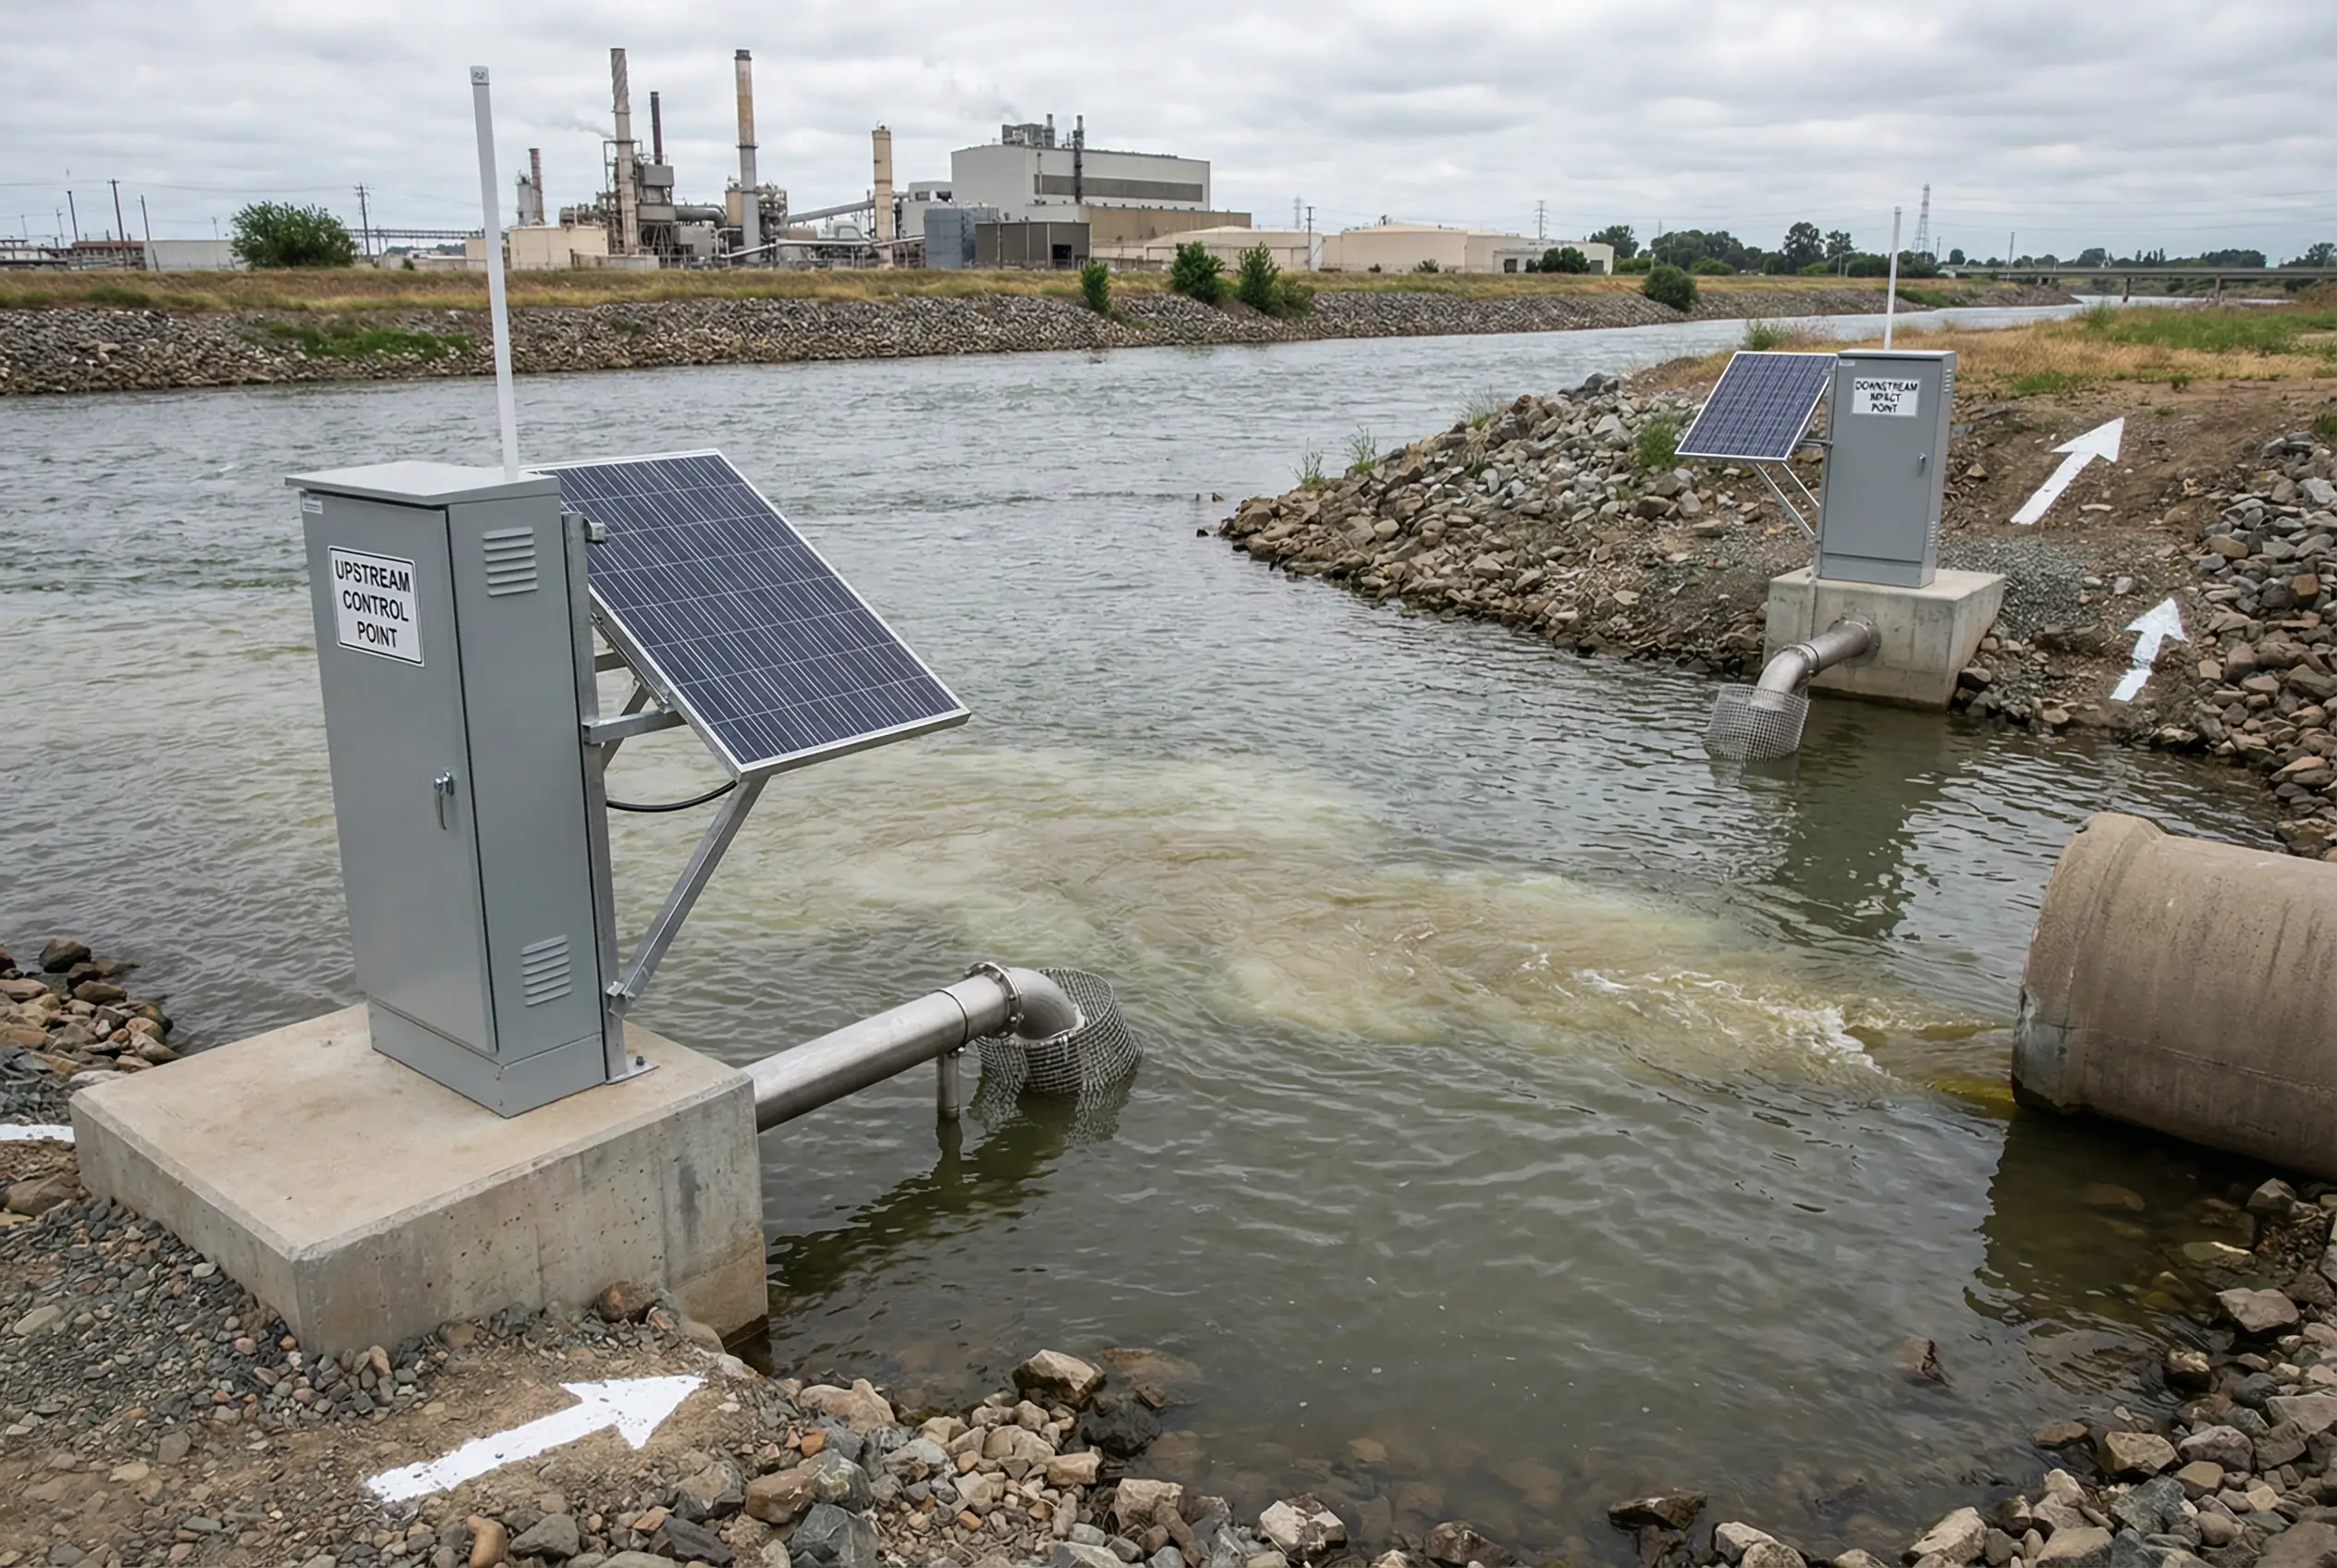
Figure 3.1: Industrial discharge impact assessment — upstream control point and downstream impact point stations on opposite riverbanks, with solar power and debris-guarded intake pipes
This scenario involves the deployment of paired monitoring stations — one upstream (control point) and one downstream (impact point) — on either side of an industrial discharge outfall. The objective is to quantify the water quality impact of the discharge by comparing upstream and downstream concentrations of key pollutants in near-real time. The paired design enables direct attribution analysis and provides legally defensible evidence for regulatory compliance evaluation.
The upstream station establishes baseline conditions unaffected by the discharge, while the downstream station captures the mixed plume. The spatial separation between the two stations must account for the mixing length of the discharge plume, which depends on river width, flow velocity, and discharge volume. In wide rivers, multiple downstream cross-sectional points may be required to capture lateral mixing gradients.
| Technical Indicator | Specification |
|---|---|
| Core Parameters | pH, DO, EC, Temp, ORP, Turbidity, COD proxy (UV254), Ammonia-N |
| Sampling Interval | 5–15 minutes (configurable); event-triggered 1-min burst mode |
| Intake Depth | 0.4–0.6× water depth from surface; mid-channel preferred |
| Alarm Logic | Downstream minus upstream differential threshold; rate-of-change alert |
| Communications | 4G/5G primary; NB-IoT backup; VPN encrypted |
| Power | Grid + UPS (4 h bridging); or solar + 100 Ah battery (≥5 days autonomy) |
| Auto-sampler | Recommended; triggered on alarm for chain-of-custody sample collection |
| Data Retention | Edge: 30 days; Platform: ≥3 years |
Scenario 2 — Agricultural Reservoir Inlet Monitoring
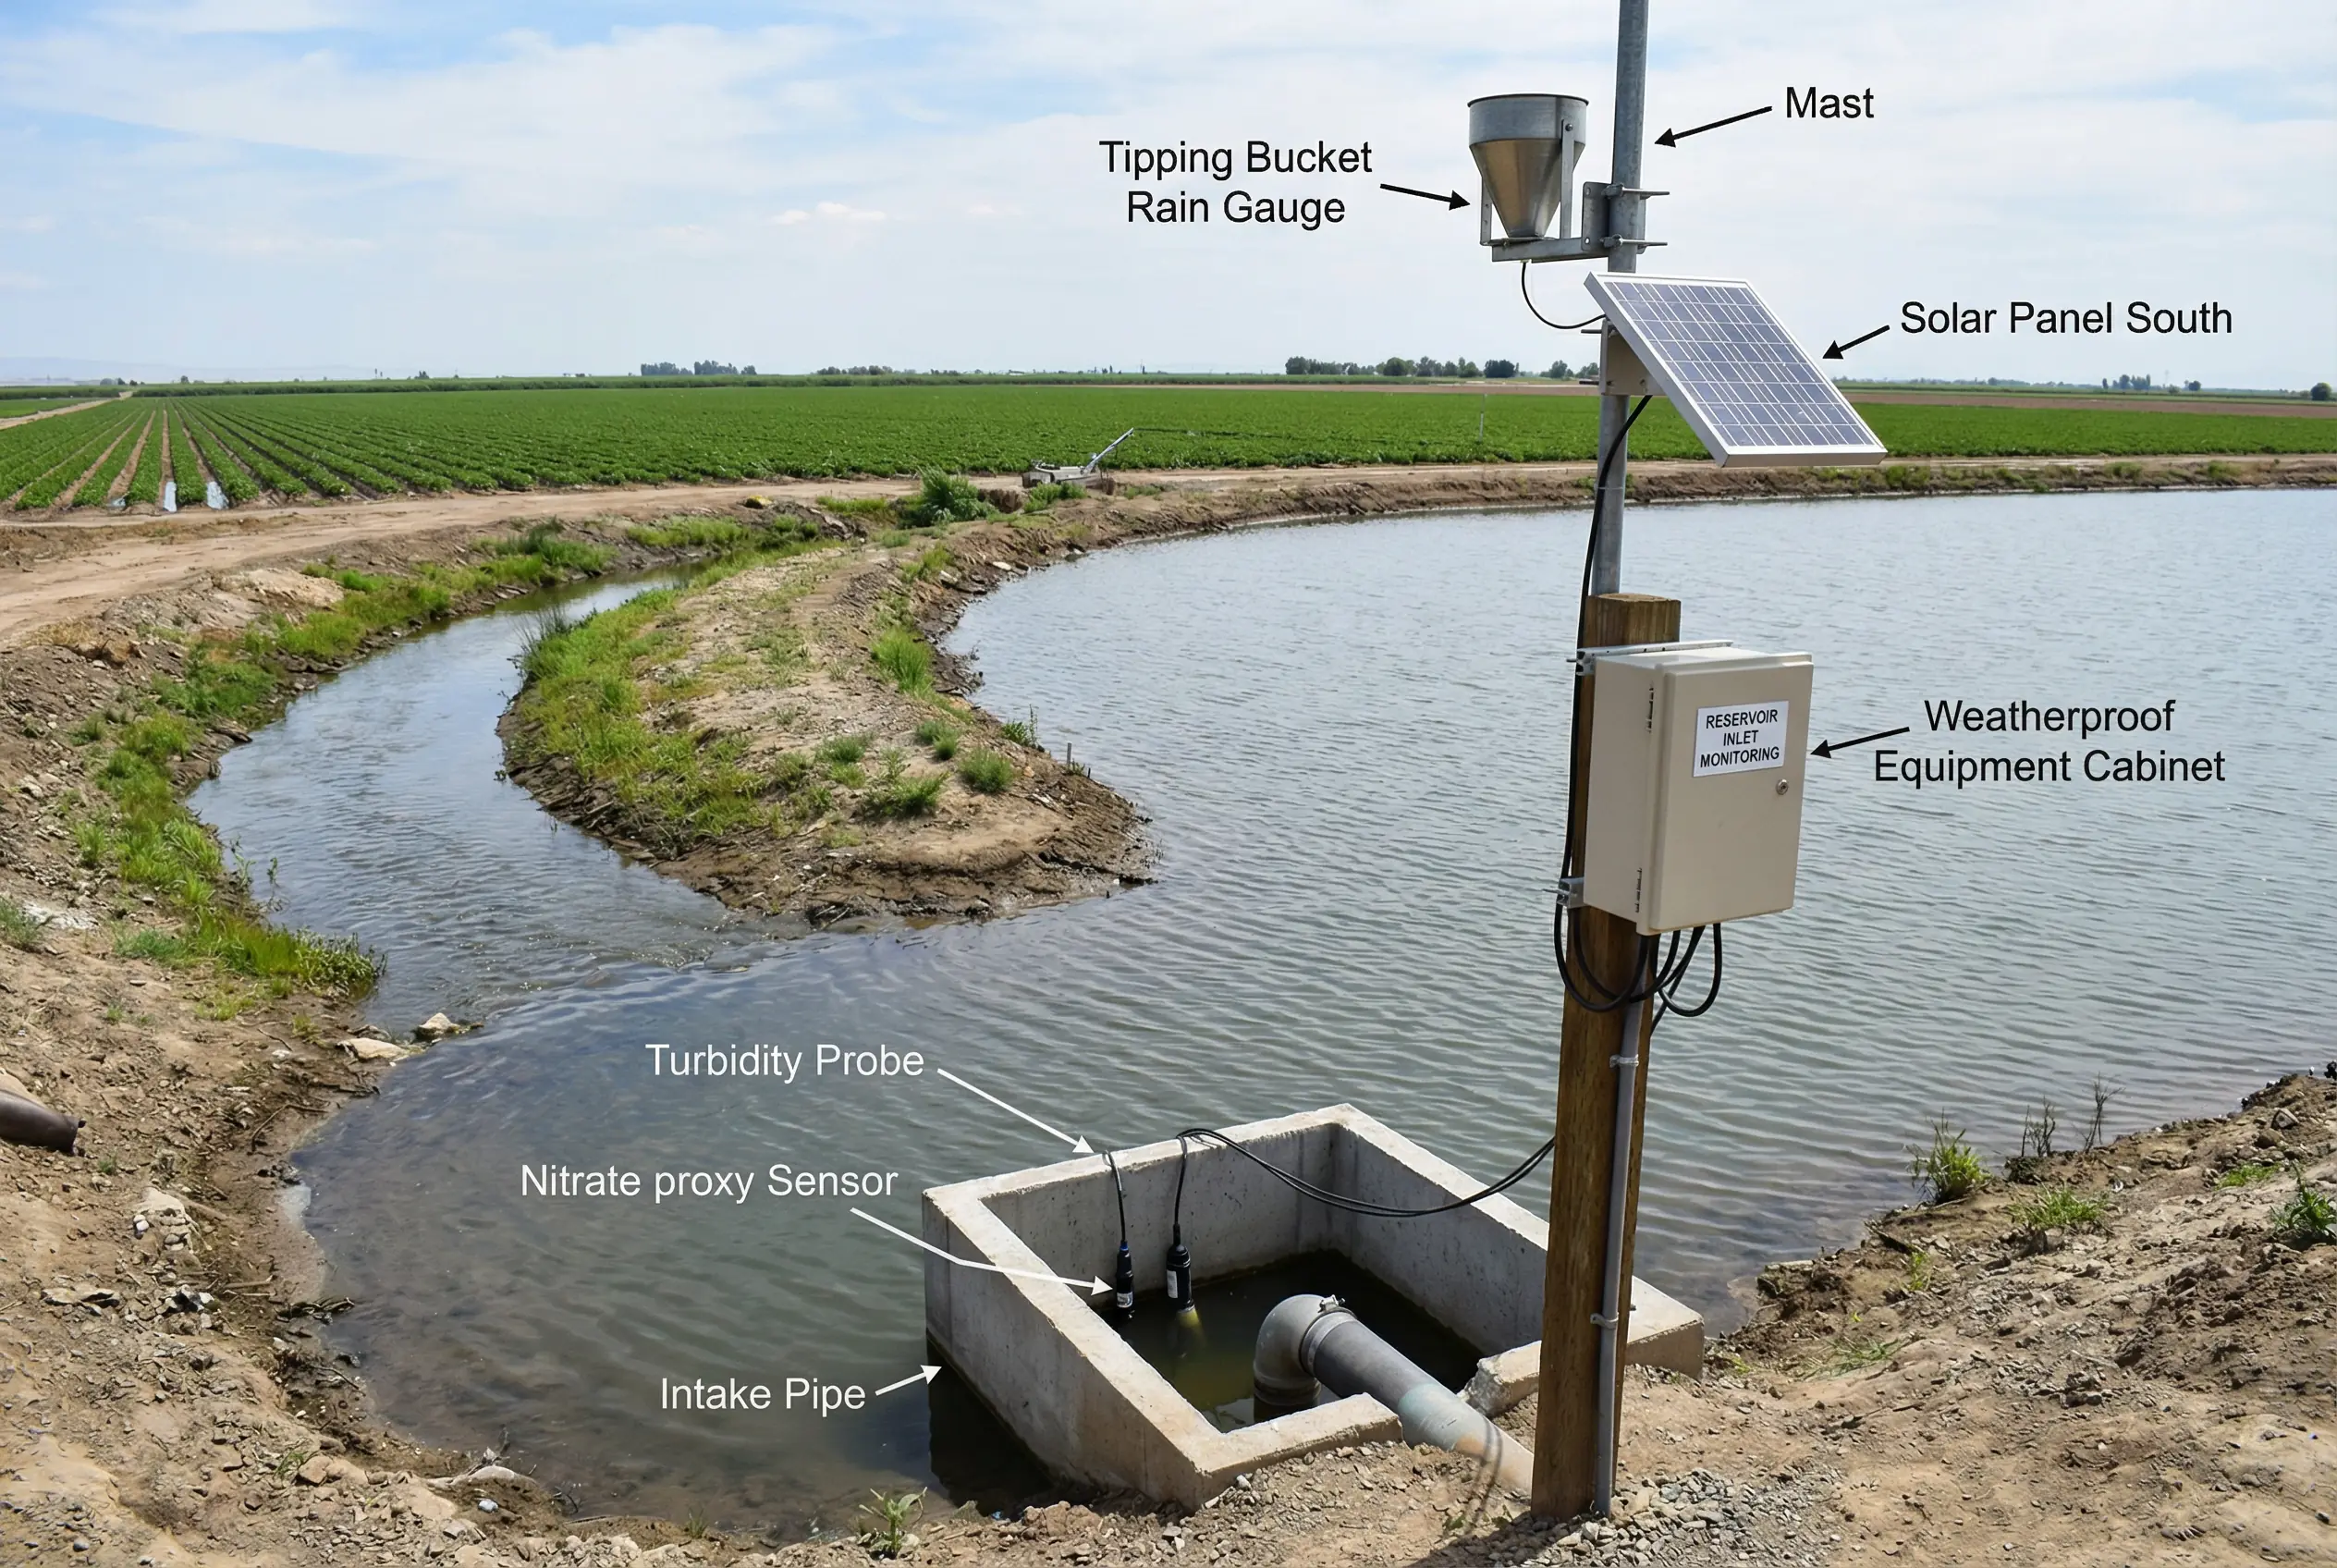
Figure 3.2: Agricultural reservoir inlet monitoring — stilling well intake, turbidity and nitrate sensors, tipping bucket rain gauge, and solar-powered cabinet at tributary inlet
Agricultural watersheds generate diffuse pollution loads dominated by nutrients (nitrate, phosphate), suspended sediments, and pesticides. Monitoring at reservoir inlets captures the integrated load from the upstream catchment and provides early warning of eutrophication risk. The stilling well design reduces the influence of wave action and surface turbulence on sensor readings, which is particularly important for optical sensors such as turbidity and UV-based nitrate proxies.
Rainfall correlation is a critical analytical capability for this scenario. The tipping bucket rain gauge provides the meteorological context needed to distinguish storm-driven turbidity pulses from chronic baseline loads, and to calculate event mean concentrations (EMC) for load estimation. The monitoring data feeds directly into reservoir management decisions regarding algaecide application, aeration, and offtake depth selection.
| Technical Indicator | Specification |
|---|---|
| Core Parameters | Turbidity, Nitrate-N (UV proxy), pH, DO, EC, Water Temperature |
| Meteorological | Tipping bucket rain gauge (0.2 mm resolution), optional wind speed/direction |
| Intake Design | Concrete stilling well, 0.5 m depth, 100 µm strainer |
| Sampling Interval | 15 min normal; 5 min during rain events (rain-triggered) |
| Power | Solar 80 W + 100 Ah LiFePO4 battery; ≥7 days autonomy |
| Communications | 4G/NB-IoT; store-and-forward buffer ≥ 14 days |
| Turbidity Range | 0–4000 NTU; auto-range switching |
| Nitrate Accuracy | ±10% or ±0.5 mg/L (whichever is greater) for UV proxy method |
Scenario 3 — Lake Eutrophication & Algal Bloom Early Warning
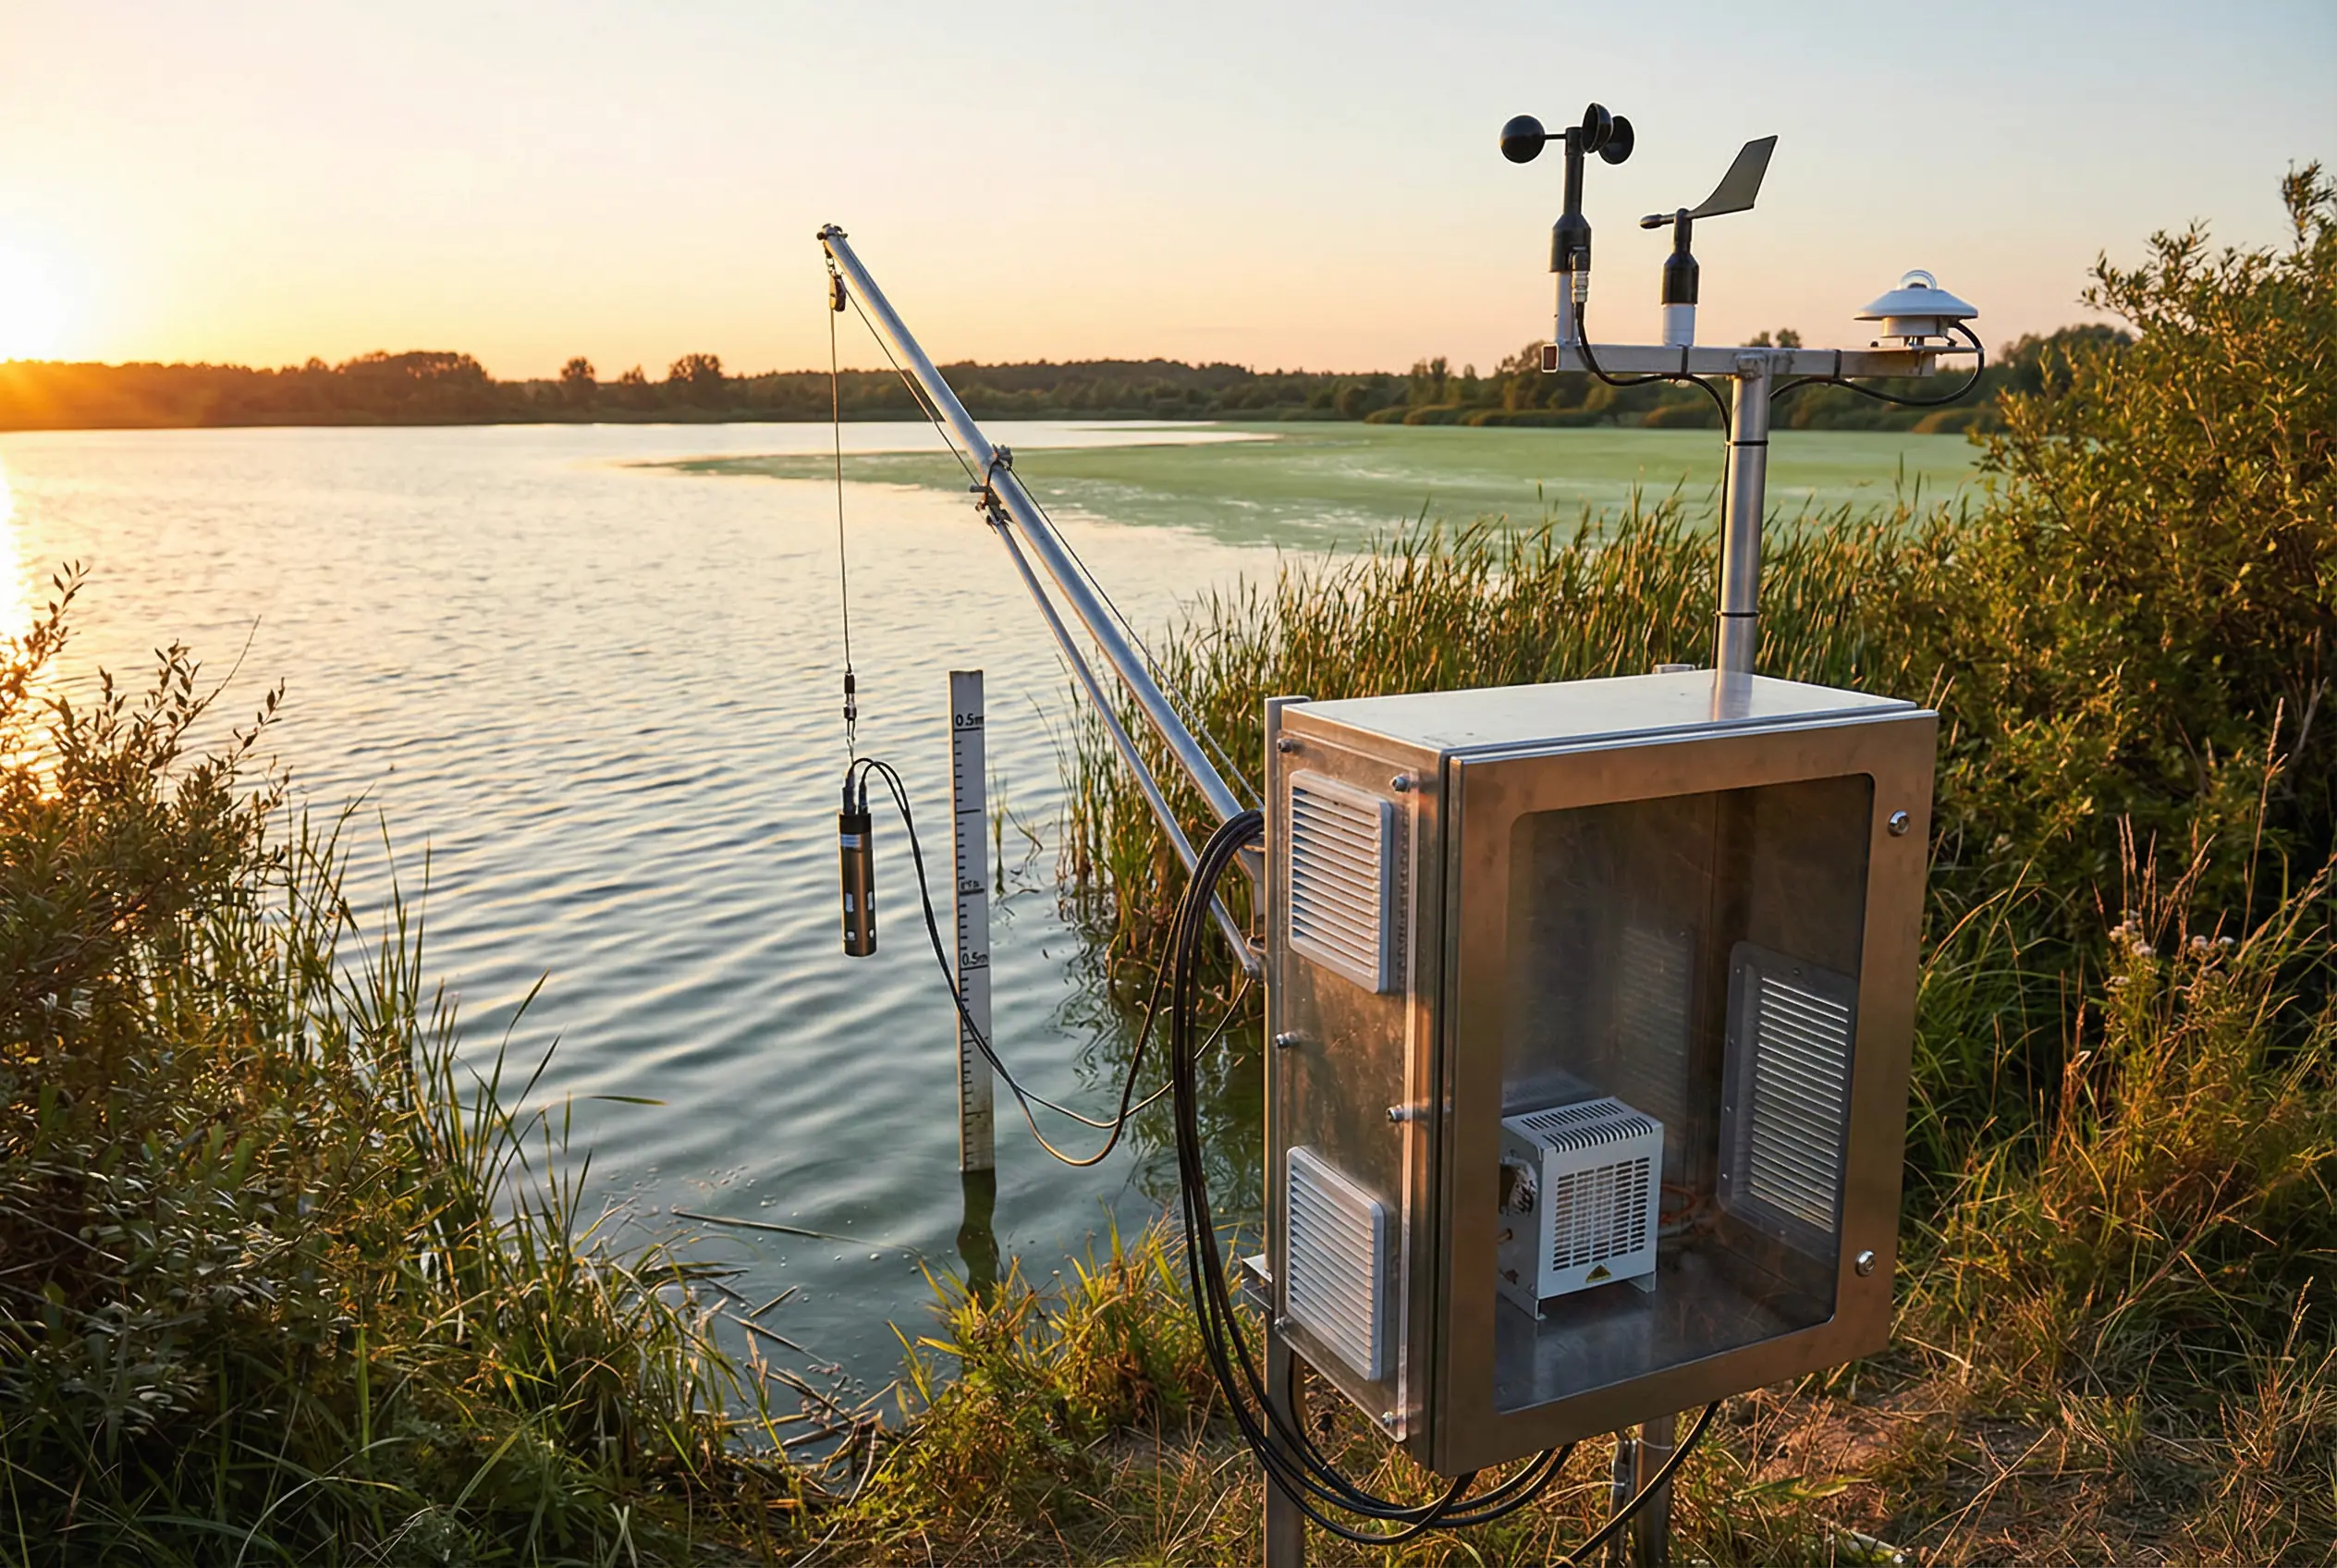
Figure 3.3: Lake eutrophication and algal bloom early warning — shoreline station with chlorophyll-a/phycocyanin sensor, weather mast, and anti-condensation cabinet; algal bloom visible on lake surface
Eutrophication monitoring in lakes and reservoirs requires detection of cyanobacterial blooms at an early stage, before toxin concentrations reach levels that threaten drinking water intakes, recreational users, or aquatic ecosystems. The phycocyanin sensor provides a cyanobacteria-specific fluorescence signal that distinguishes blue-green algae from green algae and diatoms, enabling more targeted early warning. Chlorophyll-a provides total algal biomass context.
The weather mast is essential for contextualizing bloom dynamics. Wind direction and speed drive surface accumulation of cyanobacteria, and solar radiation drives photosynthesis and stratification. The anti-condensation heater in the cabinet prevents moisture damage to electronics during the large diurnal temperature swings typical of lakeside environments. Intake depth is fixed at 0.5 m to sample the epilimnion where blooms develop.
| Technical Indicator | Specification |
|---|---|
| Core Parameters | Chlorophyll-a (µg/L), Phycocyanin (cells/mL proxy), pH, DO, Temp, EC |
| Bloom Alert Threshold | Phycocyanin > 10,000 cells/mL equivalent; Chl-a > 20 µg/L (configurable) |
| Intake Depth | 0.5 m fixed (epilimnion); optional multi-depth profiling |
| Meteorological | Wind speed/direction, solar radiation, air temperature, relative humidity |
| Anti-fouling | Optical wiper + copper anti-fouling ring; cleaning interval ≥ 7 days |
| Sampling Interval | 15 min; 5 min during bloom alert state |
| Cabinet | IP55 stainless steel; internal heater 50 W; ventilation with filter |
| Power | Solar 100 W + 150 Ah battery; ≥5 days autonomy in winter |
Scenario 4 — Drinking Water Source Protection
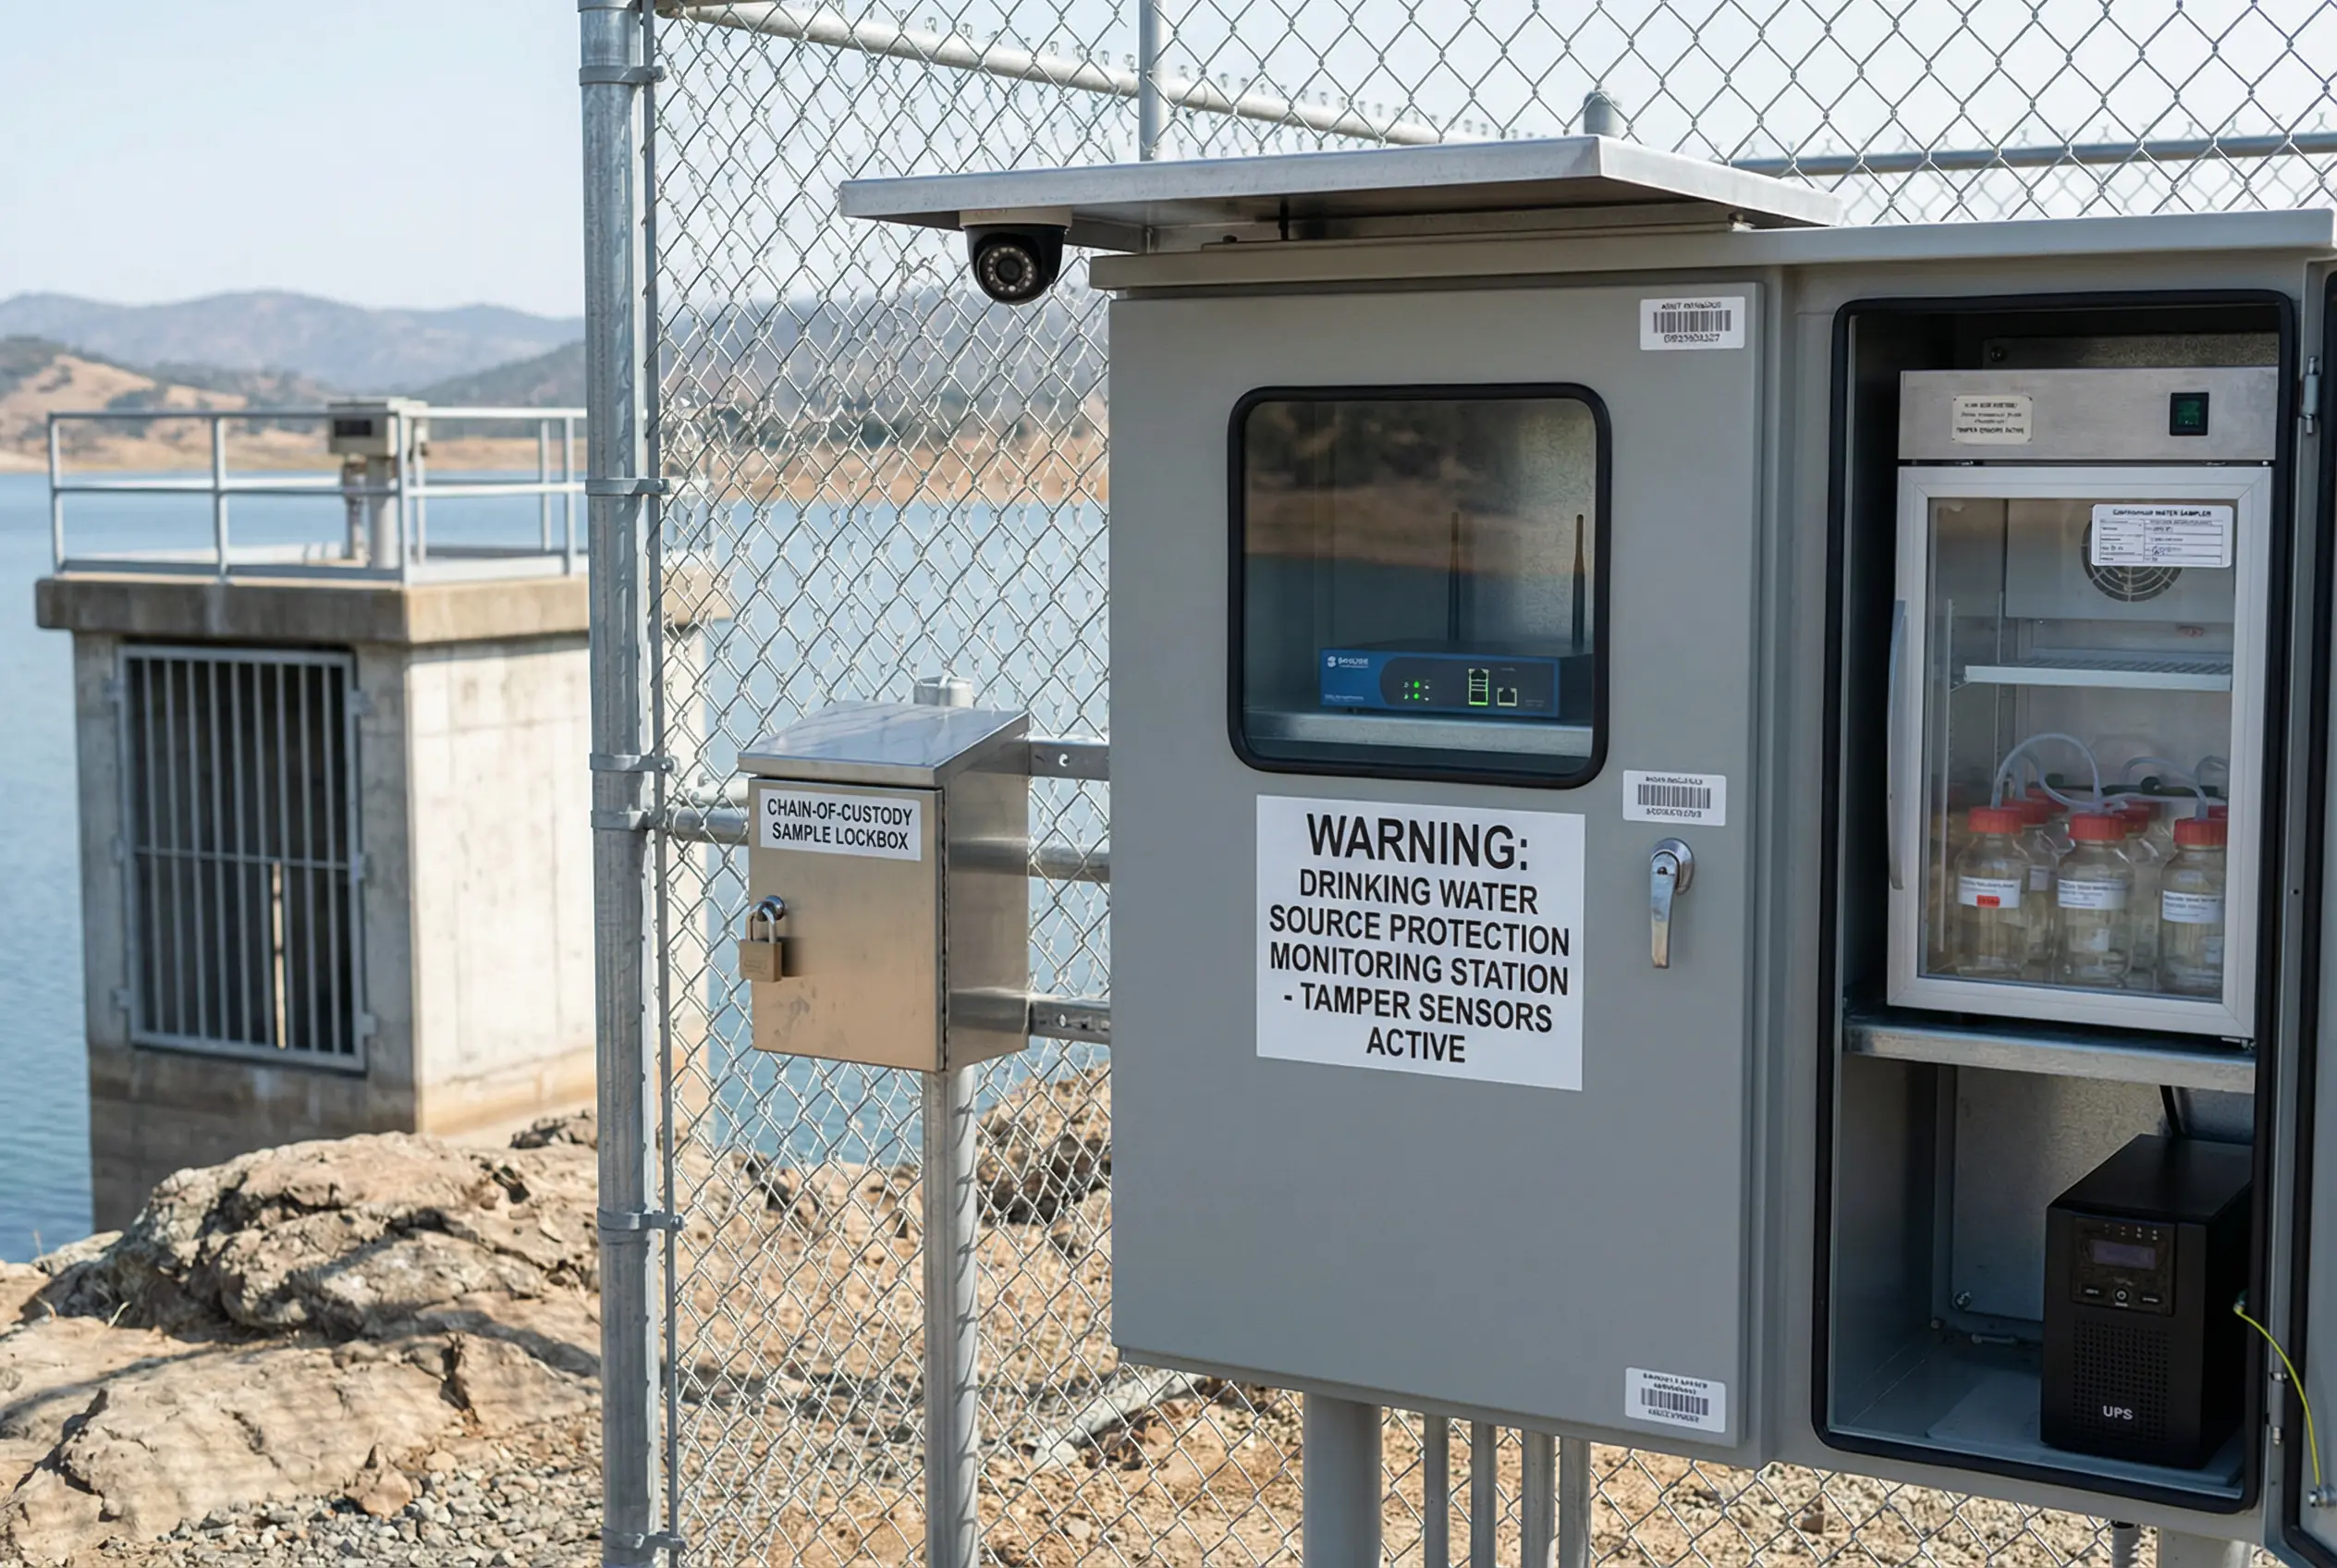
Figure 3.4: Drinking water source protection — secured monitoring station with refrigerated auto-sampler, tamper sensors, IP camera, UPS backup, and chain-of-custody lockbox at reservoir outlet
Drinking water source protection monitoring demands the highest level of data integrity, security, and traceability. The station must provide continuous early warning of any quality deterioration that could affect the downstream treatment plant, while maintaining a complete audit trail for regulatory purposes. The refrigerated auto-sampler is triggered automatically on alarm events to collect time-stamped, chain-of-custody samples for laboratory confirmation of online sensor readings.
Physical security is a critical design element. The station is enclosed within a security fence with tamper-detection switches on all access points. An IP camera provides visual verification of any access events. The UPS ensures continuous operation during power outages, and the dual SIM router provides communications redundancy. All data is transmitted with end-to-end encryption and digital signatures to prevent tampering in transit.
| Technical Indicator | Specification |
|---|---|
| Core Parameters | pH, DO, EC, Turbidity, Temp, ORP, Chlorophyll-a, Ammonia-N, COD proxy |
| Auto-sampler | 24-bottle refrigerated (0–4 °C); event-triggered + scheduled; chain-of-custody log |
| Security | Tamper switch + IP camera + vibration sensor; alarm to central platform |
| Communications | Dual SIM 4G/5G; fiber backup if available; VPN + TLS 1.3 |
| Power | Grid + UPS 4 h; solar backup for extended outages |
| Data Integrity | Signed time-series; audit log ≥ 180 days; data retention ≥ 5 years |
| Alarm Latency | ≤ 5 minutes from threshold breach to notification delivery |
| QA/QC | Daily zero/span check; weekly calibration verification; monthly full calibration |
Scenario 5 — Flood-Prone River Monitoring
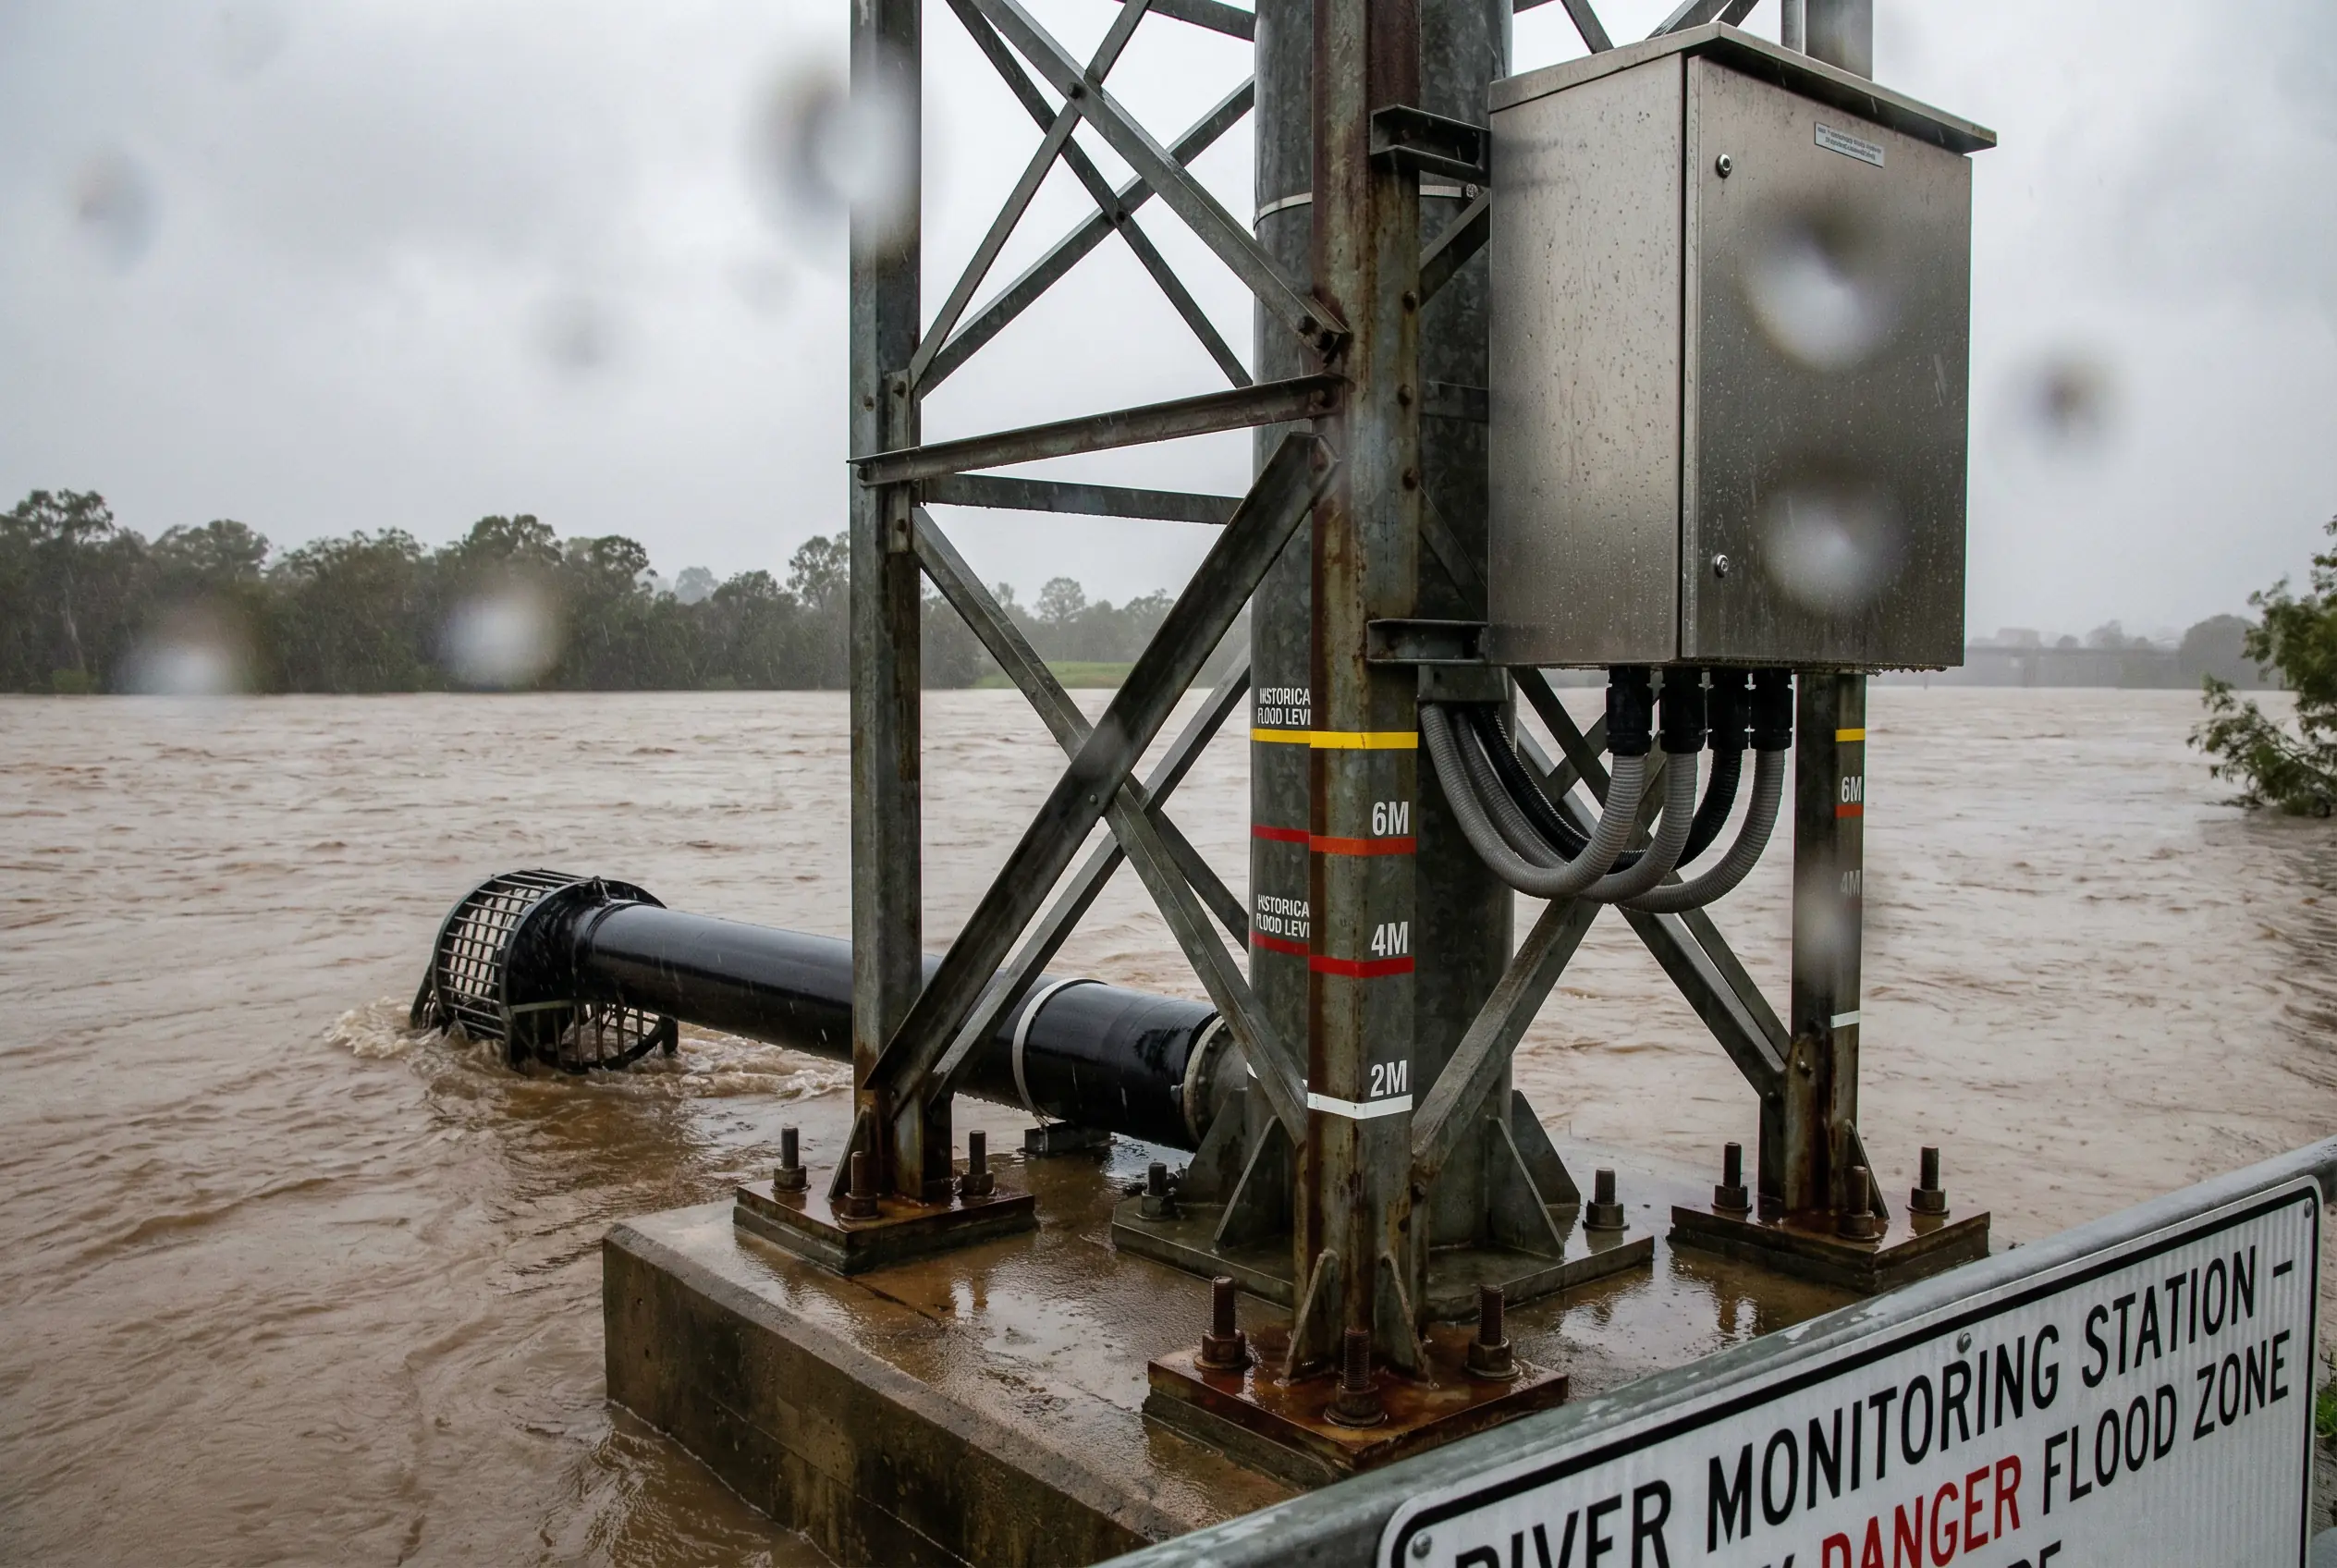
Figure 3.5: Flood-prone river monitoring — elevated steel frame station with cabinet above historical flood level, large debris guard, quick-disconnect intake, and flood depth marks on the support pole
Rivers subject to seasonal flooding present extreme challenges for monitoring station design. The station must survive complete inundation of the lower structure, resist debris impact from floating logs and vegetation, and resume normal operation immediately after floodwaters recede. The elevated steel frame positions the cabinet above the historical maximum flood level, while the intake pipe is designed for quick disconnection to prevent damage from floating debris during peak flood events.
Flood events are also the most important monitoring periods for water quality, as they carry the highest pollutant loads from the catchment. The system must therefore maintain data collection continuity during floods, using robust communications (satellite backup if 4G infrastructure is also affected by flooding) and ensuring the edge buffer is large enough to store data through extended outages.
| Technical Indicator | Specification |
|---|---|
| Mounting Height | Cabinet base ≥ 0.5 m above historical maximum flood level |
| Intake Design | Quick-disconnect coupling; debris guard mesh 10 mm; flexible hose section |
| Cabinet Rating | IP67 (submersible to 1 m for 30 min); stainless steel 316L |
| Core Parameters | Turbidity, pH, DO, EC, Temp, Water Level (pressure + radar dual) |
| Communications | 4G primary; satellite (Iridium/Inmarsat) backup for flood events |
| Edge Buffer | ≥ 30 days at 5-min interval |
| Structural | Hot-dip galvanized steel frame; anchor bolts into concrete footing; wind load 50 m/s |
| Flood Alert | Water level rate-of-change alarm; pre-flood sampling burst mode |
Scenario 6 — Remote Mountain River (Off-Grid)
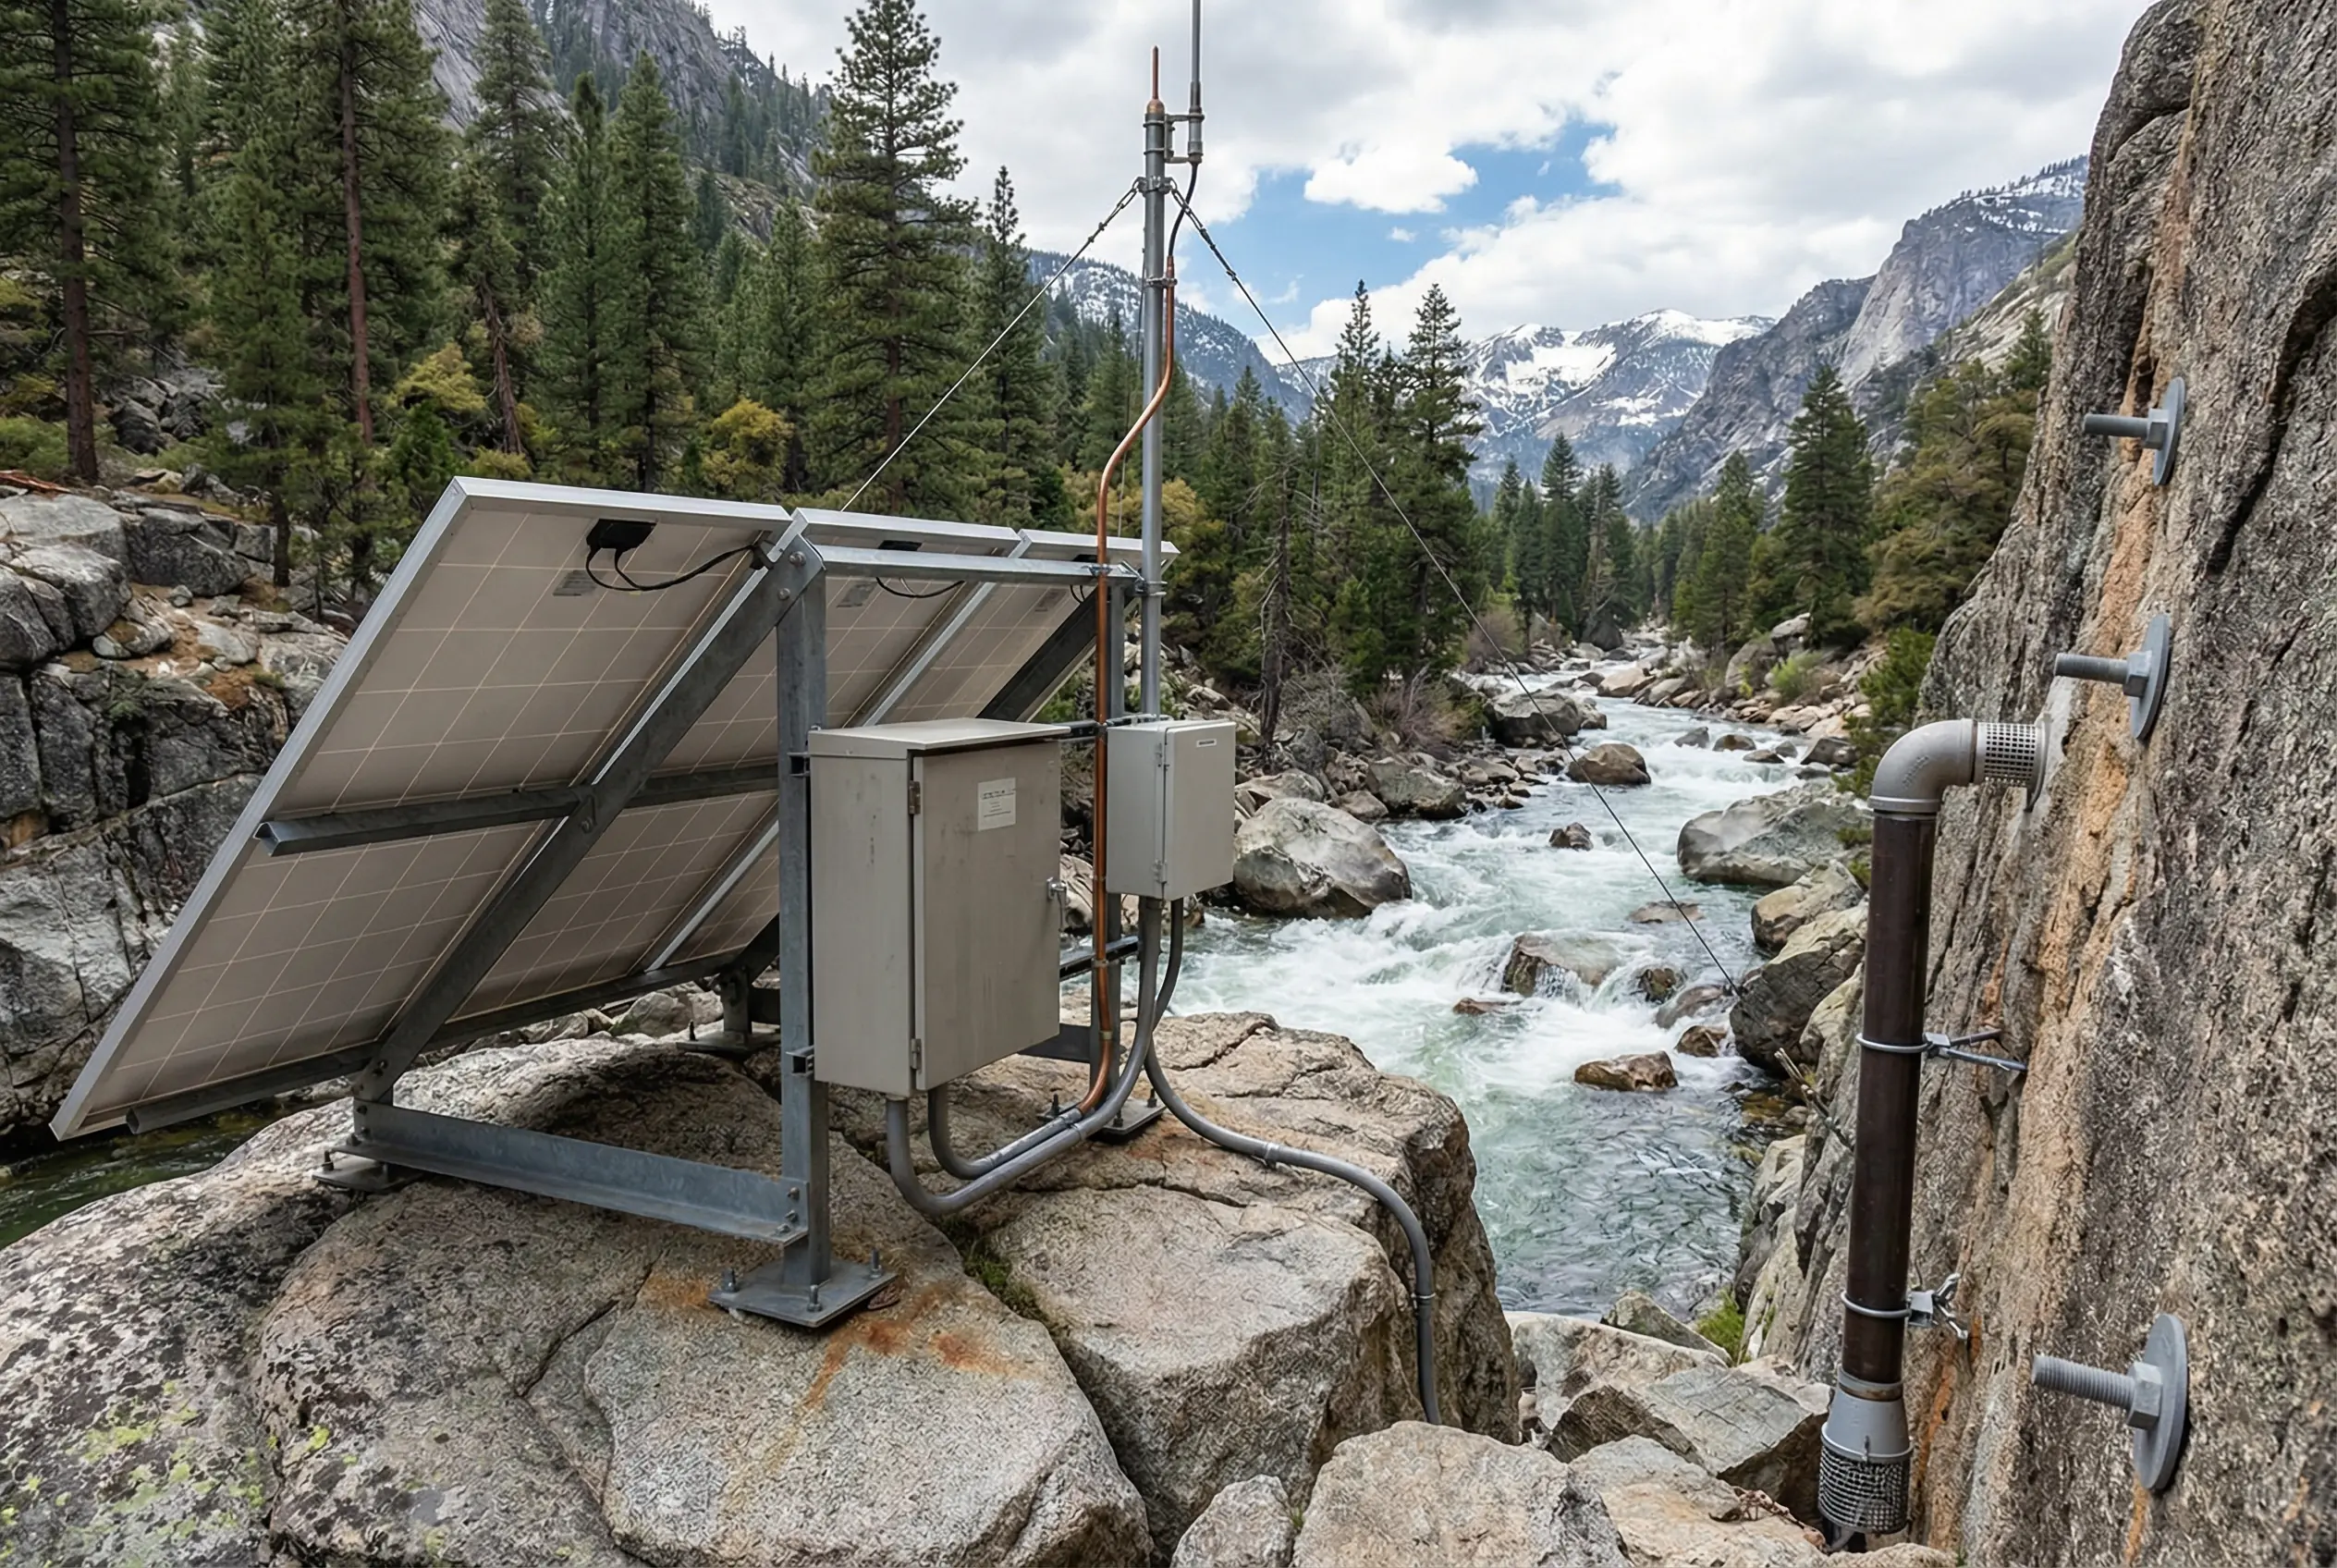
Figure 3.6: Remote mountain river off-grid monitoring — solar array on rock-mounted frame, battery cabinet, lightning-protected antenna mast, and rock-bolt secured intake pipe in mountain canyon
Remote mountain rivers present the most challenging deployment environment: no grid power, no cellular coverage, difficult access for maintenance, extreme temperature swings, high UV radiation, and the risk of flash floods and avalanche debris. The system design must prioritize energy autonomy, communications resilience, and minimal maintenance frequency. Solar power with a large battery bank provides energy independence, while satellite communications (Iridium or Inmarsat) provide the only reliable uplink from remote canyons.
The lightning protection system is particularly critical in mountain environments, where the station is often the tallest structure in the area and exposed to frequent thunderstorms. The grounded copper down-conductor provides a low-impedance path for lightning current, and surge protection devices (SPDs) on all signal and power lines prevent equipment damage from induced voltages. Intake pipes are secured with rock bolts to prevent displacement by flash floods.
| Technical Indicator | Specification |
|---|---|
| Power System | Solar 200 W + LiFePO4 200 Ah; ≥10 days autonomy at -20 °C |
| Communications | Satellite (Iridium SBD) primary; LoRa relay to nearest 4G gateway if available |
| Reporting Interval | 1 hour normal; 15 min during events (to conserve satellite bandwidth) |
| Core Parameters | pH, DO, EC, Temp, Turbidity, Water Level |
| Temperature Range | Operating: -30 °C to +60 °C; battery heating below -10 °C |
| Lightning Protection | IEC 62305 Class III; SPD Type 2 on AC and signal; copper down-conductor |
| Maintenance Interval | Designed for ≥ 6-month unattended operation |
| Access | Helicopter or foot access; all consumables sized for 6-month supply |
Scenario 7 — Urban River with Vandalism Protection
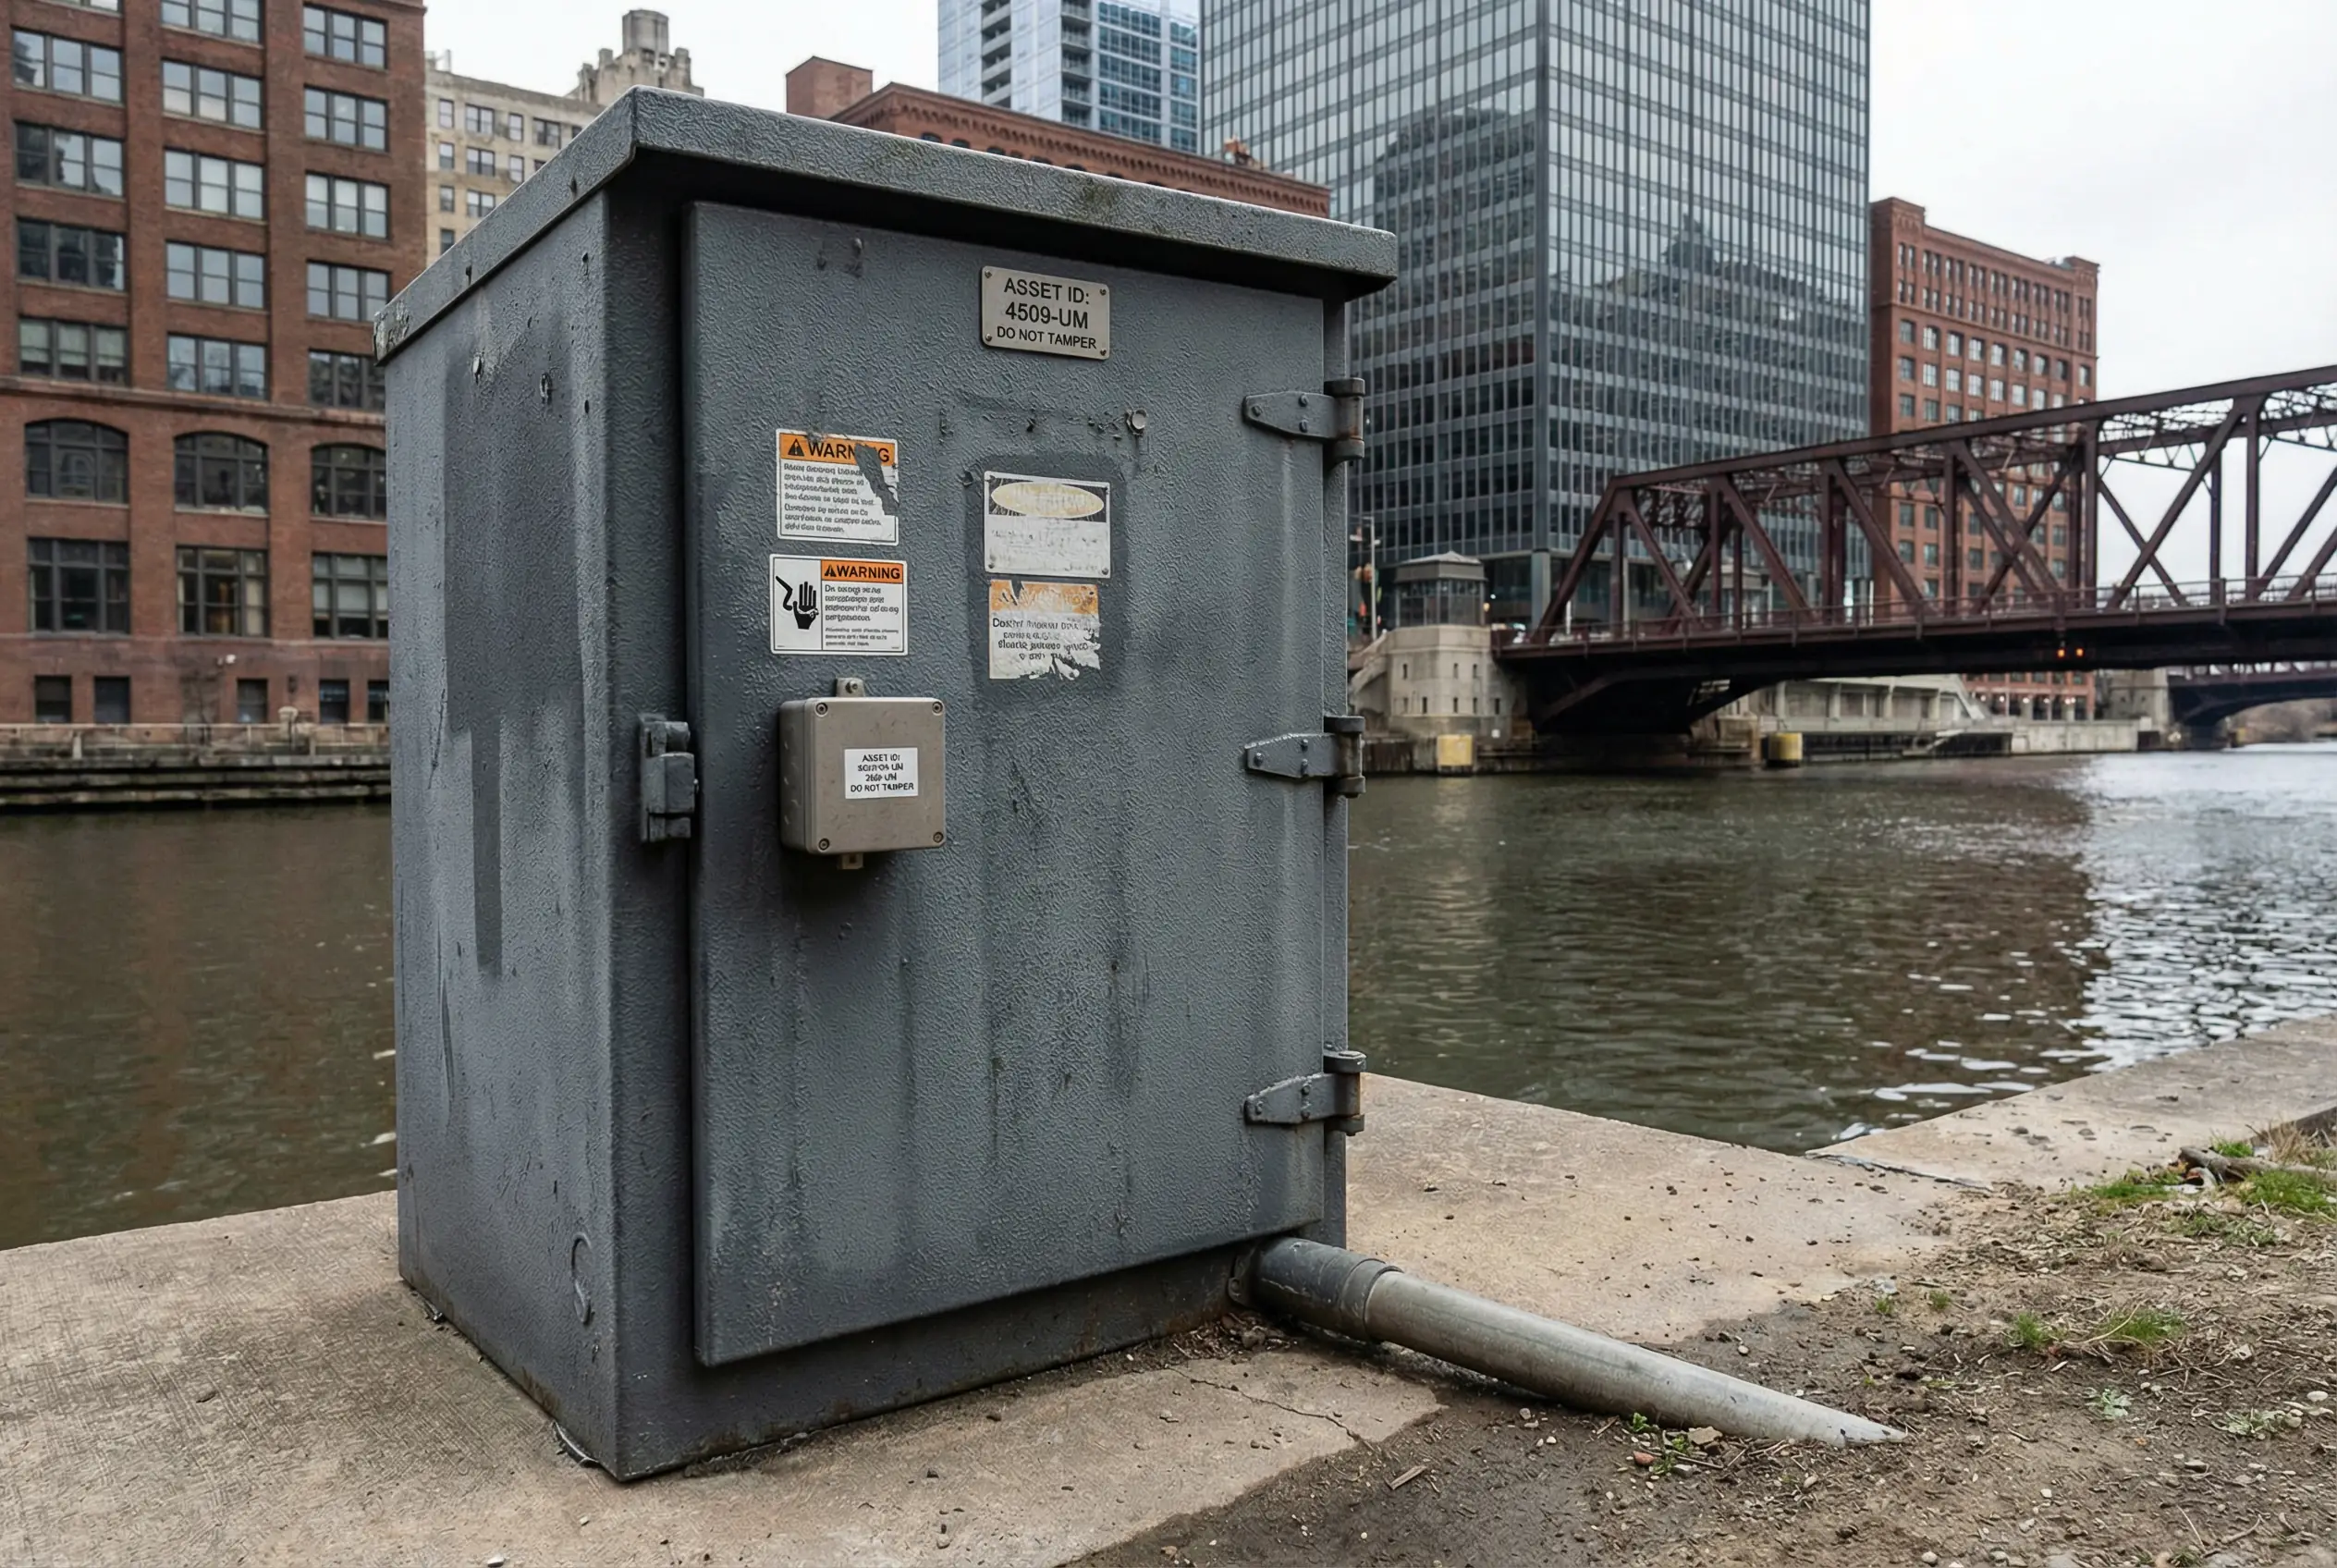
Figure 3.7: Urban river monitoring — hardened kiosk cabinet with anti-pry hinges, vibration sensor, graffiti-resistant coating, hidden conduit routing, and asset tags in urban riverbank environment
Urban river monitoring stations are exposed to vandalism, theft, and deliberate tampering at a much higher rate than rural deployments. The station design must balance accessibility for maintenance personnel with resistance to unauthorized access and physical damage. The hardened kiosk enclosure uses thick steel walls, anti-pry hinges, multi-point locking, and a vibration sensor that triggers an alarm on any unauthorized access attempt. Cables are routed through buried conduits to prevent cable theft.
Urban environments also offer advantages: grid power is typically available, cellular communications are reliable, and maintenance personnel can reach the site quickly. The focus of the design therefore shifts from energy autonomy and communications resilience toward physical security, data integrity, and rapid response to tampering events. The station is registered with local authorities and clearly labeled with emergency contact information to deter casual vandalism.
| Technical Indicator | Specification |
|---|---|
| Cabinet | 3 mm steel; anti-pry hinges; 3-point locking; graffiti-resistant powder coat |
| Tamper Detection | Vibration sensor + door contact switch; alarm within 30 s |
| Cable Protection | All cables in buried steel conduit; waterproof connectors at surface |
| Core Parameters | pH, DO, EC, Temp, Turbidity, ORP, Ammonia-N (urban runoff focus) |
| Power | Grid 220V AC + UPS 4 h; no solar (urban shading) |
| Communications | 4G/5G primary; fiber if available; dual SIM |
| Maintenance Access | Keyed access log; RFID badge reader on cabinet; access events logged |
| MTTR Target | ≤ 4 hours (urban proximity advantage) |
Scenario 8 — Bridge-Mounted Hydrology Cross-Section
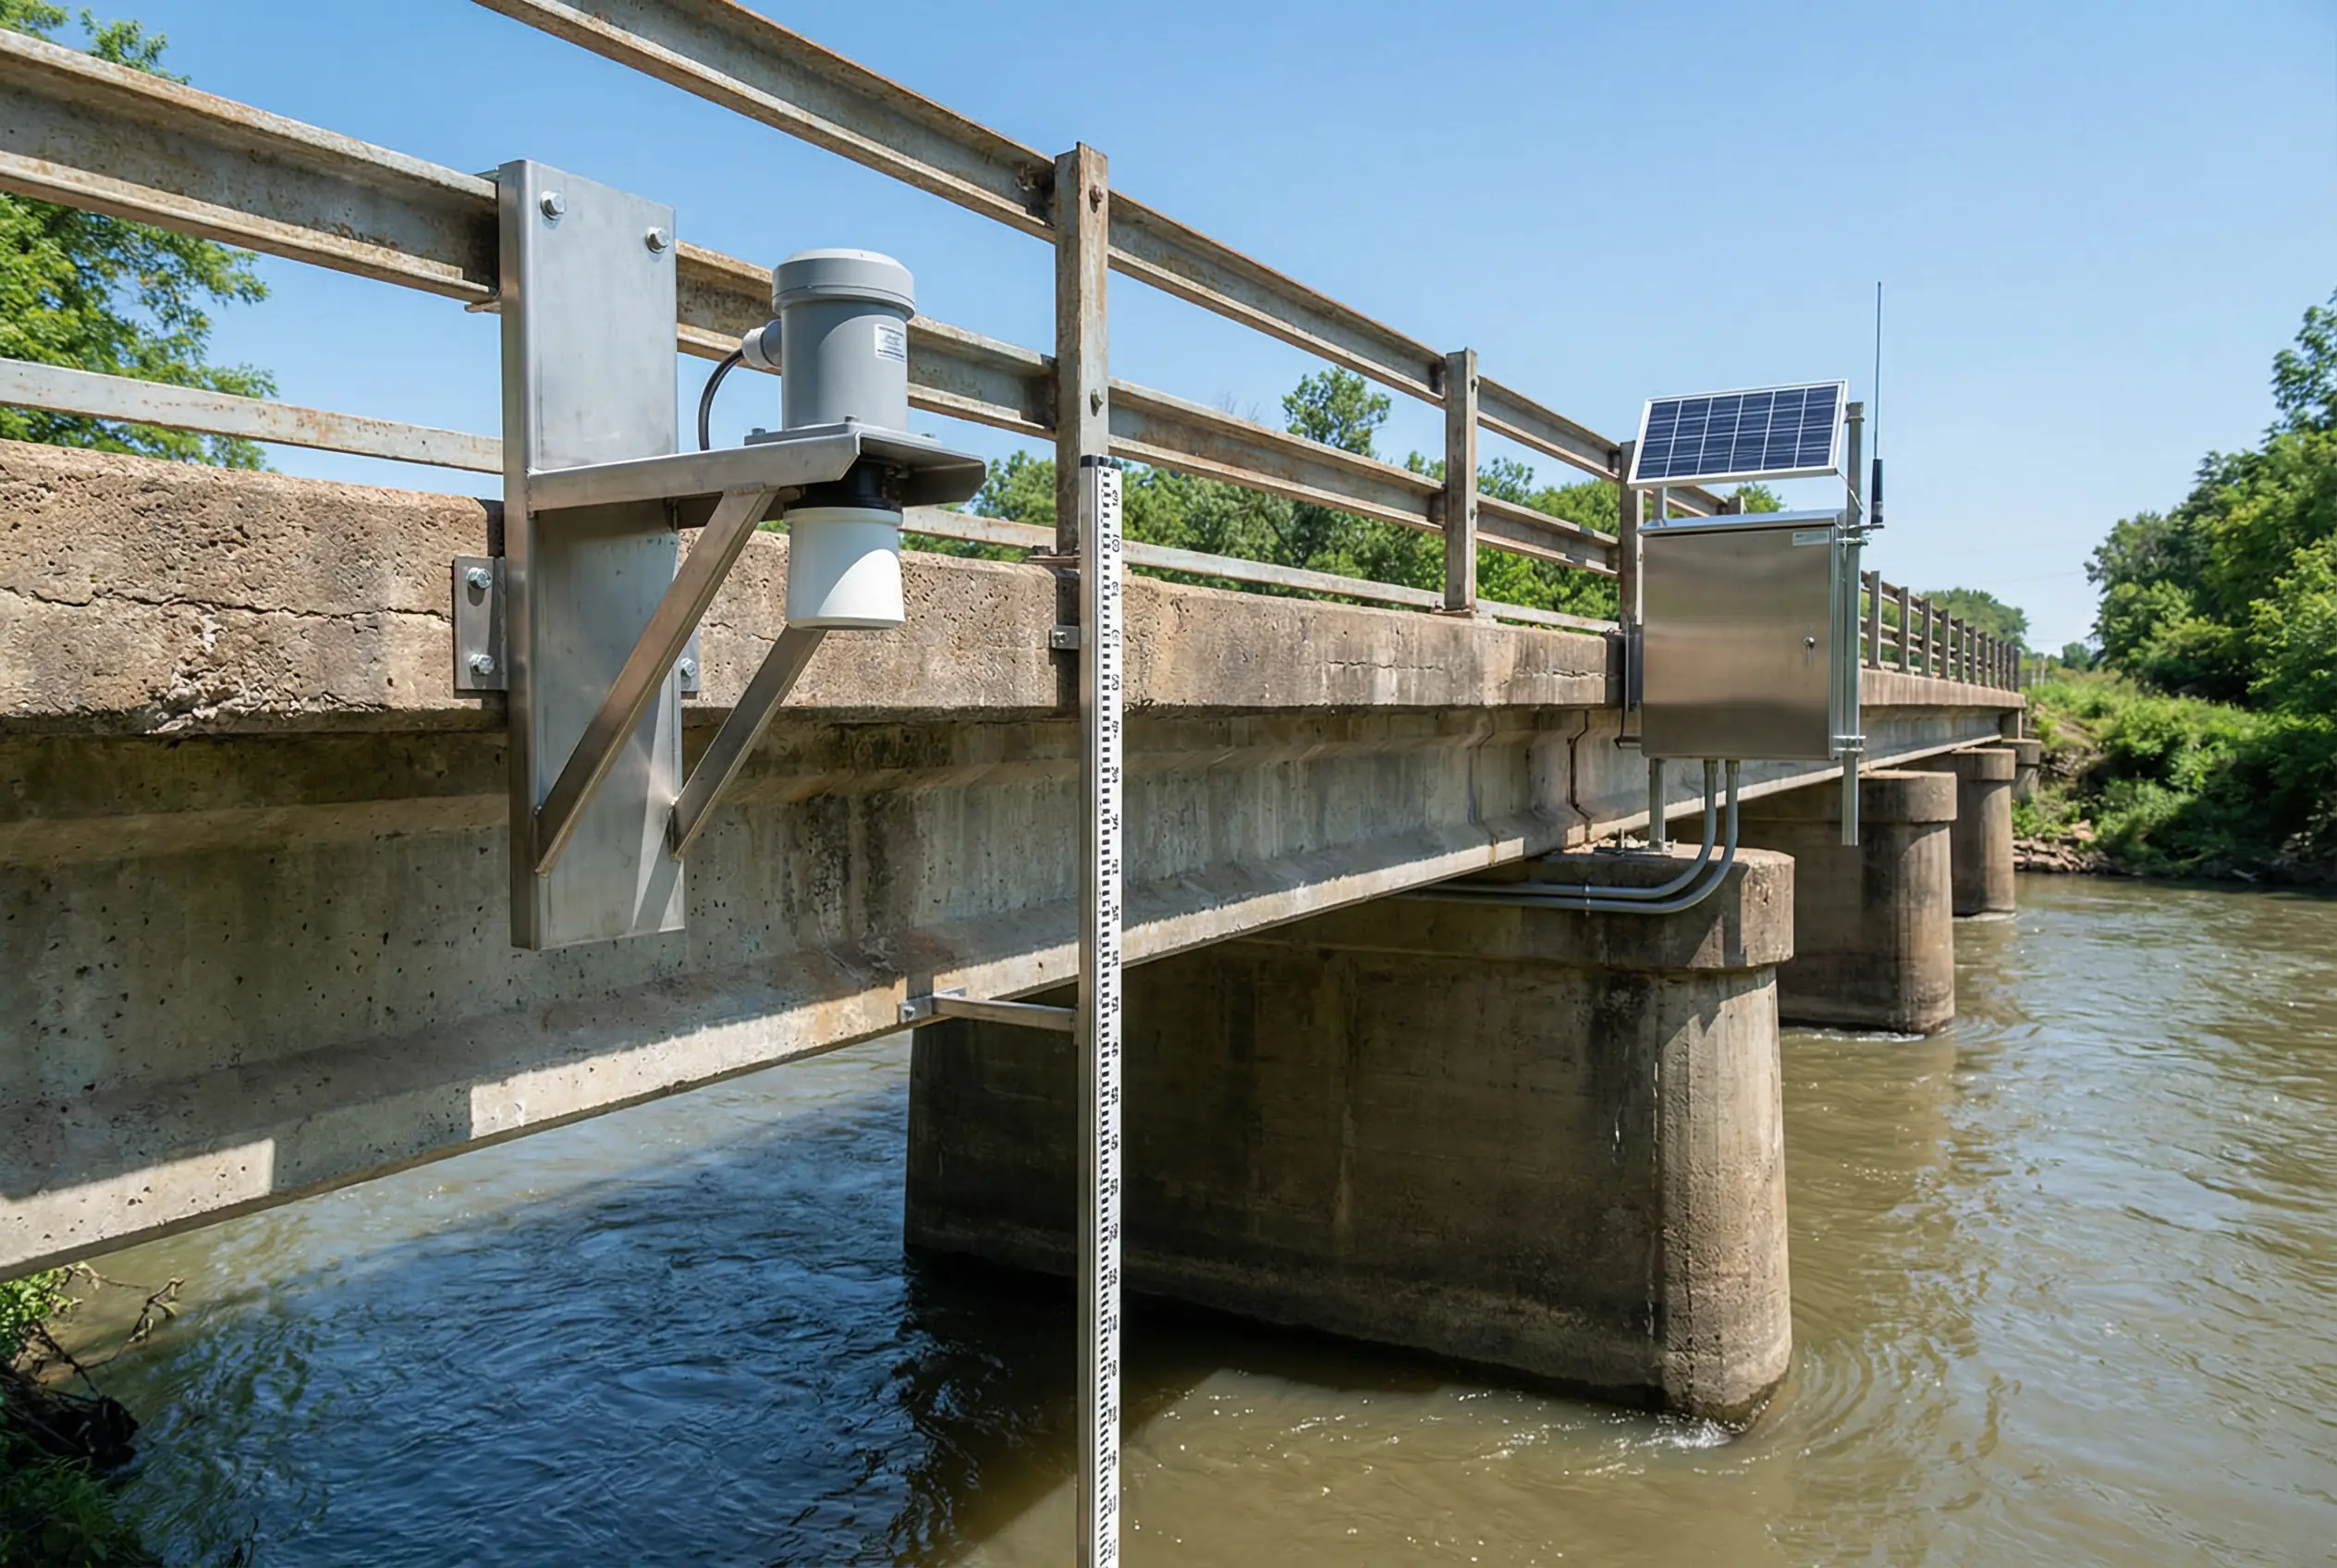
Figure 3.8: Bridge-mounted hydrology monitoring — radar water level sensor and ultrasonic sensor on stainless steel bridge bracket, reference staff gauge, and solar-powered gateway cabinet on bridge pier
Bridge-mounted monitoring stations leverage existing infrastructure to position sensors at optimal cross-sectional locations for hydrology measurements. The bridge structure provides a stable mounting platform for non-contact sensors such as radar water level gauges and ultrasonic flow sensors, eliminating the need for in-water structures that would be vulnerable to debris and flood damage. The reference staff gauge provides a visual check for field verification during site visits.
This scenario is particularly suited to rivers where in-water installations are impractical due to high flow velocities, heavy debris loads, or navigation requirements. The gateway cabinet on the bridge pier houses the data logger, communications equipment, and a small solar panel. The bridge structure itself provides some protection from direct rainfall and solar radiation, extending equipment life. However, bridge vibration must be considered in the mounting design to prevent fatigue failure of sensor brackets.
| Technical Indicator | Specification |
|---|---|
| Water Level Sensor | Radar (non-contact); range 0.3–30 m; accuracy ±3 mm; IP68 |
| Flow Measurement | Ultrasonic surface velocity (Doppler); combined with stage-discharge rating curve |
| Reference Gauge | Staff gauge 0–10 m; enameled steel; 10 mm graduation |
| Bracket Design | 316L stainless steel; vibration-damped mounting; load-rated for 50 m/s wind |
| Core Parameters | Water Level, Flow Velocity, Discharge, Turbidity (optional submersible probe) |
| Power | Solar 60 W + 80 Ah battery; or bridge utility power if available |
| Communications | 4G/5G; typically good coverage on bridge structures |
| Maintenance | Sensor accessible from bridge deck; no in-water access required |
Scenario Comparison Matrix
The table below provides a comparative overview of the eight scenarios across key design dimensions, enabling rapid identification of the most relevant scenario for a given deployment context.
| Scenario | Water Body | Primary Objective | Power | Comms | Key Challenge | Complexity |
|---|---|---|---|---|---|---|
| 1. Industrial Impact | River | Compliance / attribution | Grid/Solar | 4G+VPN | Mixing length, legal evidence | High |
| 2. Agricultural Reservoir | Reservoir inlet | Nutrient load / eutrophication risk | Solar | 4G/NB-IoT | Diffuse pollution, storm events | Medium |
| 3. Lake Algal Bloom | Lake | Bloom early warning | Solar | 4G | Optical fouling, bloom dynamics | Medium |
| 4. Drinking Water Source | Reservoir | Source protection / audit | Grid+UPS | Dual 4G+fiber | Data integrity, chain-of-custody | Very High |
| 5. Flood-Prone River | River | Flood event quality monitoring | Solar/Grid | 4G+Satellite | Structural survival, debris | High |
| 6. Remote Mountain | River | Baseline / ecological | Solar only | Satellite | Energy, access, lightning | Very High |
| 7. Urban River | River | Urban runoff / compliance | Grid+UPS | 4G/5G | Vandalism, tampering | Medium |
| 8. Bridge Hydrology | River | Flow / stage measurement | Solar/Grid | 4G | Vibration, no in-water access | Medium |