Chapter 1 — System Components
This chapter describes the complete component architecture of a surface water environmental monitoring system, covering the three deployment zones from in-water hardware through station enclosure to the central cloud platform. It details the responsibilities, inputs, outputs, and key performance indicators of each component, along with common mismatch risks and the working principles governing startup, normal operation, and exception handling.
1.1 System Architecture
The system is organized into three deployment zones that reflect the physical and logical boundaries of the monitoring infrastructure. Zone A encompasses all in-water and bank-side hardware that interfaces directly with the water body. Zone B covers the station enclosure where pre-treatment, measurement, control, and communications equipment are housed. Zone C represents the cloud or central platform where data is ingested, validated, stored, analyzed, and reported. Understanding these boundaries is essential for assigning responsibilities, designing maintenance workflows, and managing cybersecurity perimeters.
Core modules — intake assembly, pre-treatment, water quality probes, edge controller/gateway, communications, and central platform ingestion/storage/QA/QC/alarm/reporting — are mandatory in every deployment. Optional modules such as auto-sampler, refrigerated storage, advanced analyzers (ammonia, nitrate, COD/TOC proxy), hydrology instruments (ADCP, flow radar), CCTV, and satellite communications are selected based on site requirements and budget. Supporting systems including UPS/solar, lightning protection, physical security, and fire safety (where a shelter exists) are treated as core engineering requirements rather than optional add-ons.
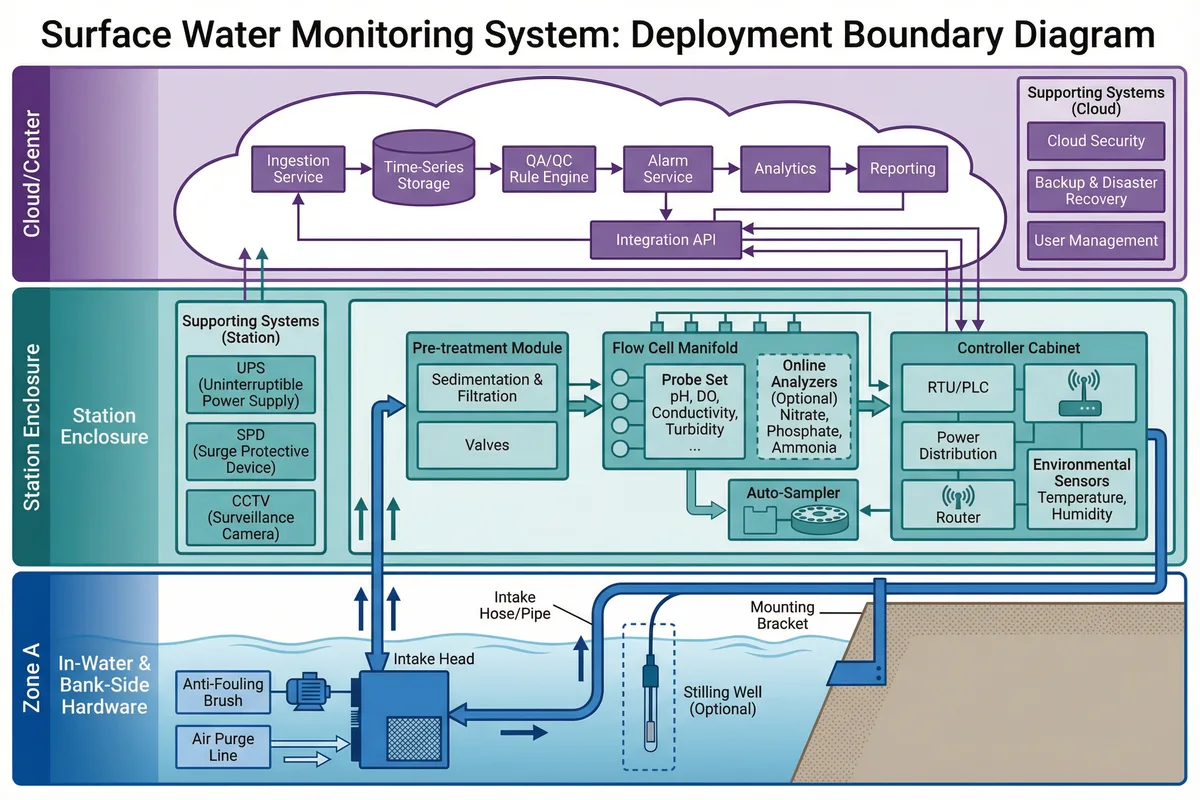
Figure 1.1: System architecture — three-zone deployment boundary diagram showing in-water hardware (Zone A), station enclosure (Zone B), and cloud/center platform (Zone C)
1.2 Components and Responsibilities
Each component in the system has a defined primary responsibility, a set of inputs and outputs, key performance indicators (KPIs), and characteristic mismatch risks that arise when the component is incorrectly specified or installed. The table below provides a structured reference for system designers and procurement engineers.
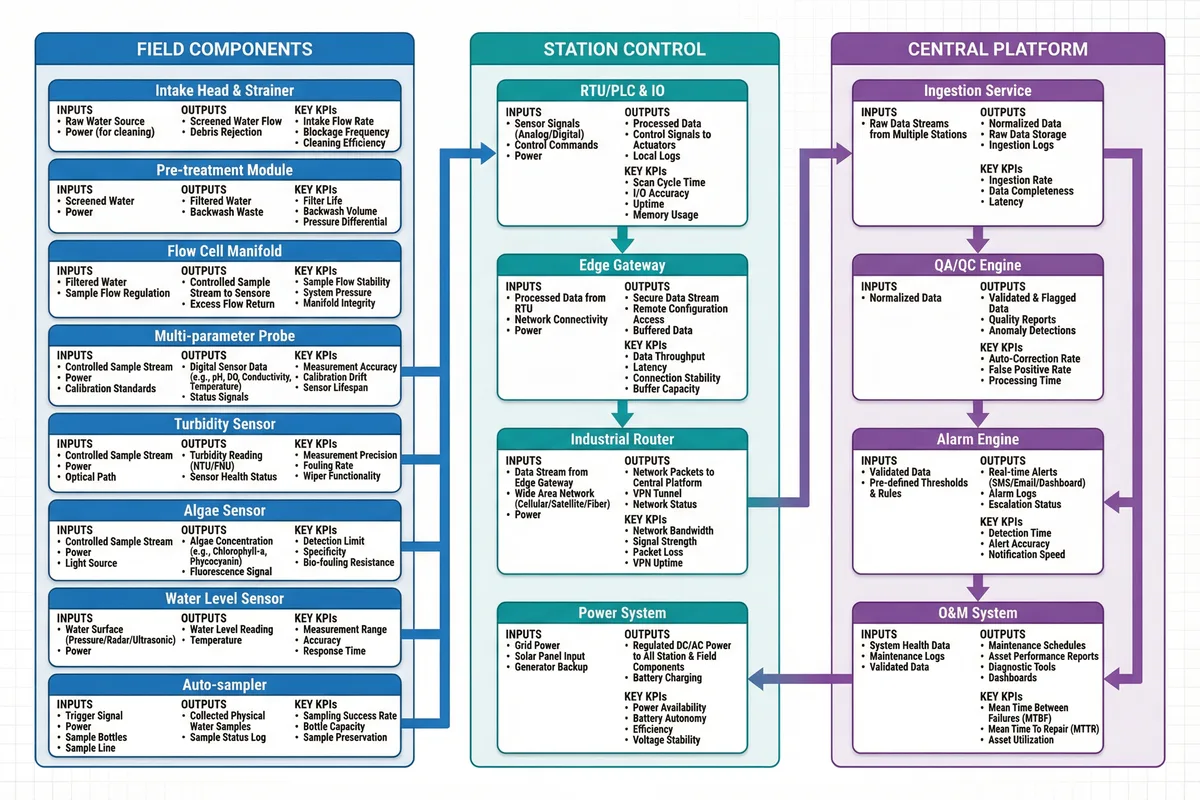
Figure 1.2: Component inventory diagram — field components, station control, and central platform with inputs, outputs, and key KPIs
| Component | Primary Responsibility | Inputs | Outputs | Key KPIs (typical) | Common Mismatch Risk |
|---|---|---|---|---|---|
| Intake head + strainer | Deliver representative raw water | River/lake water | Raw water stream | Anti-clog interval ≥ 7–30 days | Wrong depth causes bias (surface algae / bottom sediment) |
| Pre-treatment module | Debubble, reduce sediment load, stabilize flow | Raw water | Conditioned flow to sensors | Flow stability ±10%; backflush success ≥ 95% | Under-sized filter clogs daily in high turbidity |
| Flow cell manifold | Provide stable measurement chamber | Conditioned flow | Flow-through for probes | Leak rate 0; bubble rate low | Poor venting causes DO/pH spikes |
| Multi-parameter probe | Measure pH/DO/EC/Temp/ORP | Water in flow cell | Digital readings | Drift within spec; uptime ≥ 95% | Wrong materials corrode in brackish water |
| Turbidity sensor | Measure turbidity / suspended solids proxy | Water | NTU readings | Optical window fouling rate | No wiper leads to persistent high bias |
| Algae sensor (optional) | Chlorophyll-a / phycocyanin measurement | Water | µg/L or RFU | Bloom detection sensitivity | Sunlight intrusion causes measurement artifacts |
| Water level sensor | Stage monitoring | Water level | Meters (m) | Accuracy ±1 cm (site dependent) | Wrong venting for vented pressure sensor |
| Rain/wind/air temp | Meteorological context for events | Atmosphere | mm, m/s, °C | Uptime ≥ 98% | Poor siting (wind shadow, solar radiation bias) |
| Auto-sampler (optional) | Grab samples for lab confirmation | Trigger / schedule | Bottled samples + log | Sample integrity; temp 0–4 °C if required | No refrigeration breaks chain-of-custody validity |
| RTU/PLC + IO | Station logic, interlocks, control | Sensor signals | Commands + logs | Deterministic control; watchdog | Insufficient IO isolation introduces noise |
| Edge gateway | Protocol conversion, local buffering | RTU data | MQTT/HTTPS payload | Buffer ≥ 7–30 days | Storage too small loses outage data |
| Industrial router | Secure uplink to central platform | SIM/Ethernet | VPN tunnel | MTBF, reconnect time | NAT/firewall misconfig blocks inbound management |
| Power system | Stable DC power to all station components | AC/solar | DC bus | Autonomy hours | Battery undersized causes brownouts |
| Central ingestion | Validate and store incoming data | Encrypted payload | Time-series records | Latency, loss rate | Schema mismatch silently drops fields |
| QA/QC engine | Apply validity flags to data | Data + metadata | Flags + annotations | False reject rate | Rules ignore seasonal effects |
| Alarm engine | Notify and escalate threshold events | Thresholds/events | SMS/email/webhook | Time-to-notify | Too many alarms causes operator fatigue |
| O&M system | Maintenance traceability and scheduling | Tickets, logs | Audit trail | Closure SLA | Lack of discipline breaks traceability |
1.3 Working Principles
Startup Sequence
On power-on, the station controller performs a self-test of all IO channels and verifies valve positions. The intake pump starts and the pre-treatment line is flushed for a configurable period (typically 3–10 minutes) to clear stagnant water. The flow cell stabilizes, sensors warm up, and initial readings are flagged "stabilizing." The first valid sample is recorded only after stability criteria are met — specifically, when the rate-of-change of key parameters falls below the configured limit and flow rate is within the target band. This prevents erroneous early readings from entering the data record.
Normal Operating Cycle
During normal operation, the station executes a repeating cycle that includes: (1) continuous measurement at the configured sampling interval, (2) periodic automatic cleaning via wiper actuation, air purge, or chemical injection on a schedule adapted to fouling conditions, (3) scheduled calibration checks against reference solutions, (4) edge buffering and encrypted uplink to the central platform, and (5) platform-side QA/QC tagging and alarm evaluation. The edge gateway maintains a local time-series buffer sufficient to survive the worst expected network outage without data loss.
Exception Chains
The system is designed to handle predictable failure modes through defined exception chains. Three representative chains are described below, illustrating how the system detects, responds to, and recovers from common failure scenarios.